Real-Time Visualization
Watch robot arms move as you adjust joint angles and link lengths. Drag targets, see manipulability ellipsoids, and trace end-effector paths.
このコンテンツはまだ日本語訳がありません。
Textbook kinematics gives you equations for one configuration at a time. Change a link length or joint angle, and you recalculate everything from scratch. The Robot Arm Kinematics suite puts the full analysis in your browser: adjust parameters in real time, visualize workspace envelopes, compare IK algorithms head to head, and even train a neural network to learn kinematics. No installation required. #Robotics #Kinematics #InteractiveSimulation
Real-Time Visualization
Watch robot arms move as you adjust joint angles and link lengths. Drag targets, see manipulability ellipsoids, and trace end-effector paths.
Comprehensive Analysis
Position analysis, workspace mapping, manipulability indices, convergence plots, and algorithm comparison charts. All computed analytically or via validated algorithms.
A/B Configuration Comparison
Save one configuration, change parameters, and overlay both datasets on every chart. See exactly how each change affects kinematics performance.
Professional Downloads
Export CSV data, PNG charts, lab report templates, workspace analysis data, and animation videos. All generated for your specific parameters.
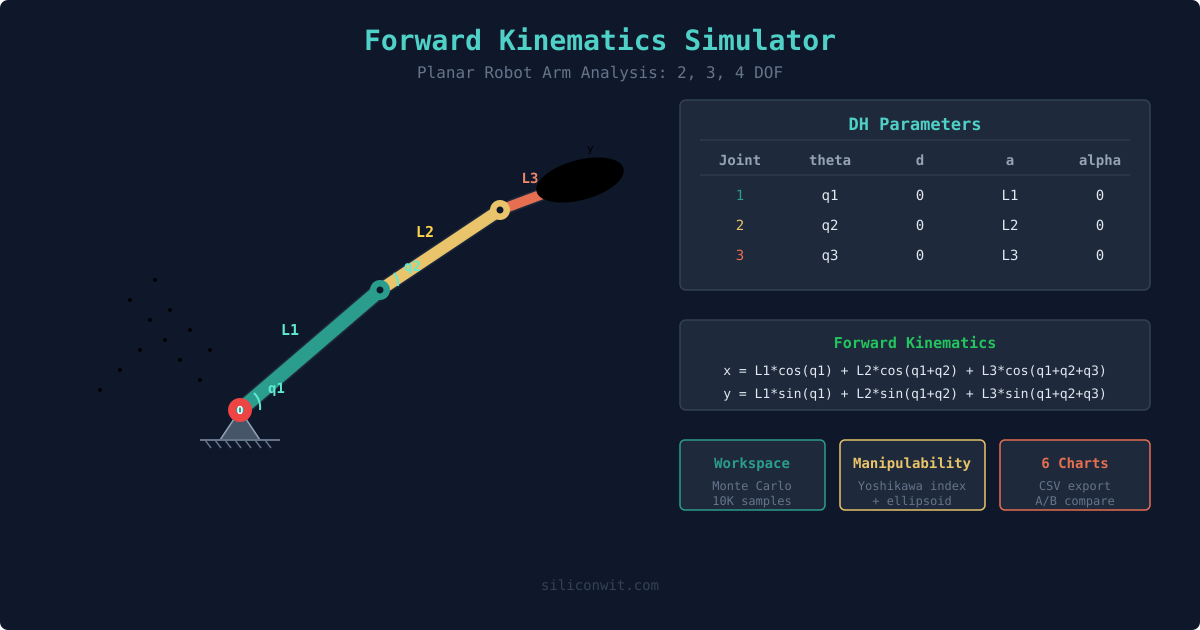
Forward Kinematics
Given joint angles, compute end-effector position. Supports 2, 3, and 4 DOF planar arms. Workspace envelope mapping via Monte Carlo sampling, manipulability analysis, DH parameter display, and transformation matrices.
Inverse Kinematics
Given a target position, compute joint angles using 5 different algorithms: Geometric (closed-form), Jacobian Pseudoinverse, Damped Least Squares, CCD, and FABRIK. Compare convergence speed and accuracy, follow predefined paths, and explore the workspace boundary.
AI Neural Network Kinematics
Train a real neural network (TensorFlow.js) in your browser to solve inverse kinematics. Configure network architecture, watch the loss curve update live during training, visualize prediction error heatmaps across the workspace, and compare with analytical solutions.