



Bearing and lubrication loads
Peak sliding speed sets the oil-film demand and the friction power lost at every joint.
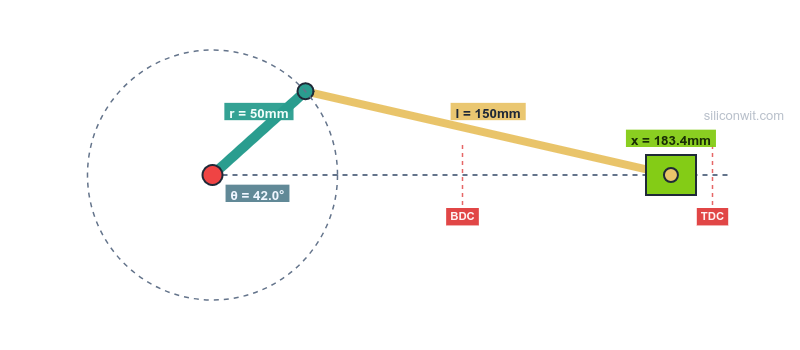
Position analysis found where every link sits for a given input angle. Velocity analysis answers the next question: how fast is each link moving at that instant? The answer comes almost for free, because velocity is the time derivative of position, and you already have the position equations. Differentiate the vector loop from the position analysis and you get a set of linear equations for the velocities. Velocity matters because it sets the kinetic energy of every part, the flow rate of a pump, and the bearing loads, and because a smooth-looking mechanism can still have a sharp velocity peak that drives vibration. In this lesson you draw the velocity polygon, differentiate the loop to confirm it, and read the velocity ratio that becomes mechanical advantage. You also meet the instantaneous center, a neat velocity shortcut, and see why the course builds on the polygon rather than on it. #VelocityAnalysis #VelocityPolygon #MechanicalAdvantage
By the end of this lesson, you will be able to:
The engine in a car, the compressor in an air conditioner, and the pump in a hydraulic system are all crank-sliders. Each converts steady rotation into a back-and-forth piston motion, and the velocity of that piston is never constant through the stroke. It starts at zero, rises to a peak somewhere past mid-stroke, and falls back to zero, and exactly where the peak lands decides the bearing loads, the lubrication demand, and the vibration the machine produces.
Engineering Question: Given the input link’s angular velocity, how fast is every other point and link moving at this instant?
For the crank-slider the key output is the piston velocity. For the four-bar it is the angular velocities of the coupler and follower. For the scissor lift it is the platform velocity. All of them come from one operation: differentiating the position loop with respect to time.
Bearing and lubrication loads
Peak sliding speed sets the oil-film demand and the friction power lost at every joint.
Flow and delivery
In a pump or compressor the piston velocity is the volumetric flow rate, so its profile is the delivery curve.
Vibration
A sharp velocity peak means a large acceleration nearby (acceleration analysis), and that is what shakes the machine.
Mechanical advantage
The ratio of input speed to output speed is the velocity ratio, and it is the reciprocal of the force ratio (force analysis).
Signs: counterclockwise is positive
The convention set in the position analysis carries straight through: angles and angular velocities are positive counterclockwise. It is repeated here because velocity is the first place negative answers become common, and a sign is a physical statement, not bookkeeping.
Read every sign out loud as a direction before moving on. When a later result surprises you, the sign is usually where the story starts.
Normalisation: why results are quoted as v/(rω)
Velocities in this lesson are often reported normalised, as
The payoff is that the normalised result depends only on the geometry ratio
From Position to Velocity
The position loop is a statement that the link vectors close. Differentiating it with respect to time gives a statement that their velocities are consistent. For the four-bar position loop:
Position loop (x, y):
Differentiate (the ground
These are two linear equations in the unknown angular velocities
This is the central idea of the lesson. Position analysis was nonlinear and needed the Freudenstein trick to solve. Velocity analysis is linear, because differentiation turns the trigonometric position terms into coefficients that multiply the unknown velocities. Once you have the positions, finding the velocities is just solving two linear equations, and the same step repeated in the acceleration analysis gives the accelerations.
Velocity uses the same methods as position, in the same draw, solve, simulate rhythm: the graphical velocity polygon is the core hand method, the analytical velocity loop is its exact confirmation, and each Application ends by reading the answer off the simulator.
Build the velocity polygon with the drawing set. Draw each velocity vector to scale, head to tail, using the key rule that the velocity of one point relative to another point on the same rigid link is perpendicular to the line joining them. Where the construction lines cross closes the polygon, and you measure the unknown velocities off it with the scale rule. This is the core hand method, worked in every Application below, and the same construction becomes the acceleration polygon in the next lesson.
Differentiate the position loop and solve the resulting linear equations. Exact, fast, and easy to program; it is the method behind our simulators and the closed-form confirmation in each Application.
Every moving link has, at each instant, a point about which it appears to purely rotate: its instantaneous center (IC). Locate it and every point on the link has speed
Velocity Ratio
The velocity ratio of a mechanism is the output speed divided by the input speed. For a four-bar it is
By conservation of power (input power equals output power in an ideal mechanism), the force or torque ratio is the reciprocal of the velocity ratio:
This quantity is the mechanical advantage. It is defined here from velocities and used again in the force analysis from forces; the two views are the same number seen from opposite sides. When the output slows to a near stop (a limit position), the velocity ratio approaches zero and the mechanical advantage grows very large.
This is the central worked example. We differentiate the slider position from the position analysis and find where the piston velocity actually peaks, which is not where intuition first suggests.
Simulator and hands-on lab
Hands-on lab: Continue in the Crank-Slider Experiments lab (siwit.co/CSM). Experiment 1 plots this velocity profile; Experiment 2 explores how an offset turns it into a quick-return.
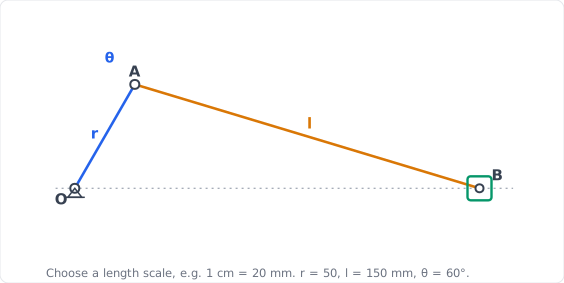
Choose and mark a length scale before you start (for a page, 1 cm = 20 mm works well); the scale is yours to pick, but always state it on the drawing. Then construct the space diagram with a set square and compass at the instant you want, here the crank at
Centre-line and pivot. Draw the cylinder centre-line horizontally and mark the crank pivot
Set the crank. From
Swing the rod. With centre
Measure. The piston sits
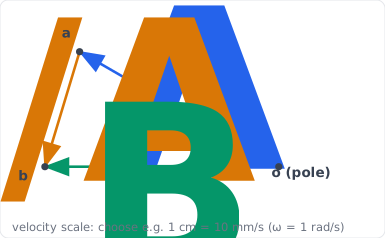
The velocity polygon solves
Crank-pin velocity. Pick a pole
Direction of the piston velocity. The piston slides along the centre-line, so
Direction of the relative velocity.
Close the polygon. Where the two construction lines cross is point
Measure.
Differentiate the slider position (
Write it as harmonics, the approximate form, obtained by setting
The secondary (twice-per-revolution) term from the connecting rod is what engine balancing must handle. ✅
Know which one you are using, and say so. The two disagree slightly. At
| Form | |
|---|---|
| Exact | |
| Harmonic (approximate) |
About
Tabulate
| Crank | |
|---|---|
| 0\degree | 0.000 |
| 30\degree | -0.646 |
| 60\degree | -1.017 |
| 73\degree | -1.055 (peak) |
| 90\degree | -1.000 |
| 120\degree | -0.715 |
| 180\degree | 0.000 |
At
The peak is about
Rod angular velocity from differentiating
The rod’s angular velocity in the counterclockwise-positive convention carries the opposite sign, because the rod leans to the other side of the centre-line from the crank (
Evaluate at the working instant
What the negative sign means physically: the crank turns counterclockwise while the rod swings clockwise. The sign is not a slip, it is the answer to “which way”, and it is what makes the crank-pin rubbing velocity in Step 5 an addition rather than a subtraction. Carry it. ✅
Check the extremes. At
A one-step check. The rod’s instantaneous center is where the crank line and the vertical through the piston cross, the same intersection that fixed
In an engine the connecting rod is a real body with mass, and every pin rubs. Two questions follow from the same polygon you already drew: how fast does a chosen point on the rod move (its inertia needs this), and how fast do the pin surfaces rub? The rubbing speed is worth knowing because it sets the friction heat, the oil-film thickness, and the wear life at each bearing: the faster a journal rubs, the more power it dissipates and the harder its lubrication has to work, so the crank pin and main bearing are sized and oiled for their rubbing speeds, not the engine’s output speed.
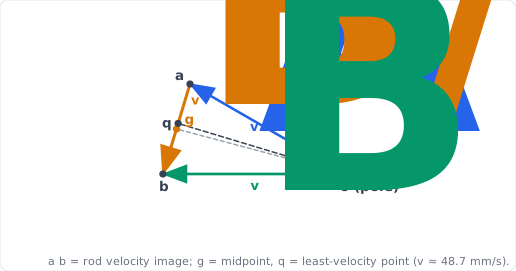
The rod’s velocity image. Every point of the rigid rod
Velocity of the rod’s mid-point
The least-velocity point. The slowest point on the rod is the one whose image is the foot of the perpendicular from the pole
Rubbing velocity at a pin. At a pin joint the two links turn at different rates, so the journal surface rubs at the relative angular velocity times the pin radius:
Use signed angular velocities inside the bars, then take the modulus. This one rule handles both cases automatically and is the only reliable way to get it right: if the two links turn in opposite senses the difference of the signed values adds their magnitudes, and if they turn the same way it subtracts them. Guessing add-or-subtract from a sketch is where marks are lost.
With
| Pin | Links joined | |||
|---|---|---|---|---|
| Main bearing | crank, frame | 25 | 25.0 | |
| Crank pin | crank, rod | 20 | 23.5 | |
| Gudgeon pin | rod, piston | 15 | 2.6 |
The crank pin has the highest relative rate because crank and rod turn in opposite senses, so the subtraction of a negative adds their magnitudes; the gudgeon pin rubs slowest because only the rod’s small
Everything above is in units of
Set it up and fix a speed. Open the simulator (siwit.co/CSM), set
That one number converts every result in this Application into what the panel shows. ✅
Predict, then read. Multiply the normalised values by
| Quantity | This lesson | Panel reads |
|---|---|---|
| Maximum Velocity | ||
| Average Velocity | ||
| RMS Velocity |
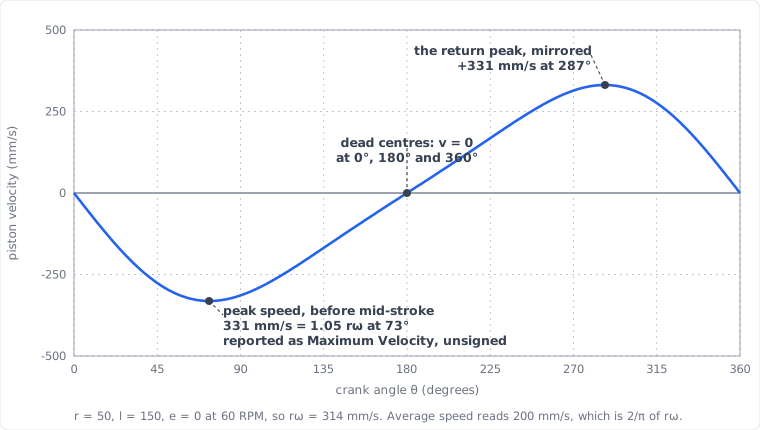
Note that speeds are reported unsigned. The fastest instant is at
Check the average against something you already know. The piston covers two strokes per revolution, so
Confirm the peak sits before mid-stroke. It falls at
The chart you should be looking at, with the same landmarks named:
For the four-bar we draw the velocity polygon to read the coupler and follower angular velocities, then confirm with the velocity loop and read the velocity ratio that becomes mechanical advantage.
Simulator and hands-on lab
Hands-on lab: Continue in the Four-Bar Linkage Experiments lab (siwit.co/FBL). The angular-velocity charts there plot
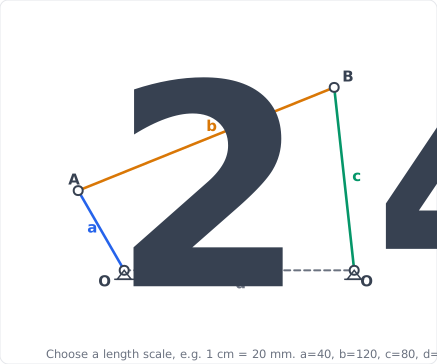
Construct the four-bar to scale at
Ground and crank. Draw the ground
Intersect the arcs. With centre
Measure. The coupler sits at
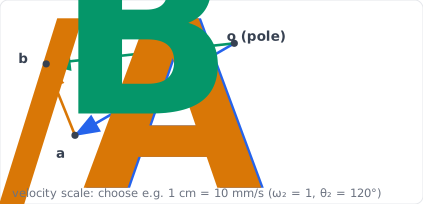
Crank-pin velocity. Pick a pole
Direction of the follower velocity. Point
Direction of the relative velocity.
Close the polygon. The two construction lines cross at
Measure and convert.
Differentiating the position loop gives two linear equations whose Cramer’s-rule solution is:
At
These confirm the
Full profile across the crank rotation:
| Crank | ||
|---|---|---|
| 30\degree | -0.262 | +0.122 |
| 60\degree | -0.040 | +0.457 |
| 90\degree | +0.064 | +0.539 |
| 120\degree | +0.139 | +0.514 |
At
Velocity ratio at
Mechanical advantage is the reciprocal:
An ideal crank torque appears amplified about twice at the follower here. The value changes through the cycle and grows large near the limit positions, which the force analysis uses.
The scissor-lift height was a one-line expression in the position analysis, so its velocity is one differentiation away.
Simulator and hands-on lab
Hands-on lab: Continue in the Scissor Lift Experiments lab (siwit.co/SLM). The platform-velocity chart plots the relation derived here.
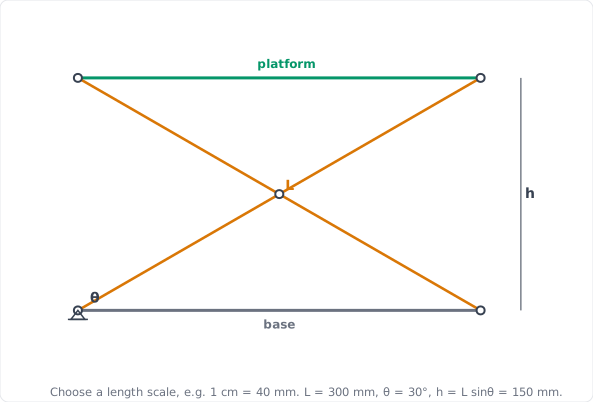
Draw the scissor to scale at
Base and arms. Draw the base horizontally. From the fixed bottom pin draw one arm of length
Platform. Join the two upper arm ends with the platform line, which stays parallel to the base. ✅
Measure. The platform height is
From the platform height
Read the behaviour. Near the flat position (
The actuator side. A constant actuator speed does not give a constant platform speed, because the geometry between actuator length and angle is itself nonlinear. The simulator’s velocity chart shows the actual platform-velocity curve for the chosen actuator type. ✅
Open the simulator (siwit.co/SLM), set
Confirm that the platform velocity is largest at low angle and tapers toward zero near full height, matching
The toggle clamp shows velocity analysis at its most dramatic: at the toggle position the output velocity ratio collapses to zero, which is the exact mechanism behind self-locking.
Simulator and hands-on lab
Hands-on lab: Continue in the Toggle Clamp Experiments lab (siwit.co/TCM). Experiment 1 shows the velocity ratio collapsing at top-dead-centre.
Sketch the four-bar skeleton at top-dead-centre, where the geometry behind self-locking becomes visible.
Ground and handle. Draw the base line
Collinear main link. Draw the main link from
Clamp arm. Join
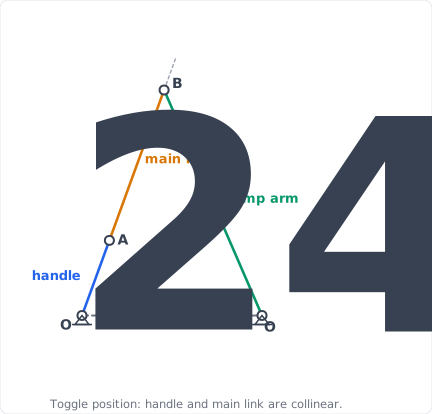
Apply the four-bar velocity solution. As the handle approaches top-dead-center, the handle link and main link become collinear. In the velocity-ratio expression, the term
The consequence. A vanishing velocity ratio means, by the power balance of the theory section, that the mechanical advantage grows very large:
A modest handle force produces a very large clamping force. This is the quantitative form of the self-locking seen in the mobility analysis.
Mobility is unchanged. The clamp still has one degree of freedom throughout. What changes at the toggle is the instantaneous velocity ratio, not the number of inputs. This is the difference between a singular configuration and a change in mobility. ✅
Open the simulator (siwit.co/TCM) and drive the handle toward top-dead-center. ✅
Watch the mechanical-advantage chart rise sharply as the links approach collinear, while the pad velocity per handle increment falls toward zero. Past the toggle by the lock margin, the clamp holds itself closed. ✅
The metal shaper of the position analysis drives its cutting ram through a crank-and-slotted-lever mechanism, an inversion of the slider-crank. It brings in something the engine did not have: the crank pin is a block that slides inside the slotted lever while the lever turns. That sliding-in-a-turning-slot is exactly the joint whose velocity polygon carries a slip vector, and whose acceleration will carry a Coriolis term.
Hands-on lab
Hands-on lab: This inversion has no simulator of its own; the drawing and the calculation confirm each other here. For the related quick-return principle, open the crank-slider simulator’s Quick-Return (offset) preset and watch the velocity curve go asymmetric, then continue in the Crank-Slider Experiments lab.
Fix the mechanism to scale at the chosen instant so the polygon has real directions to work from. The crank
Choose and note a scale, say 1 cm = 40 mm, and draw the fixed centres
Crank and block. Draw the crank
Slotted lever. Draw the lever from
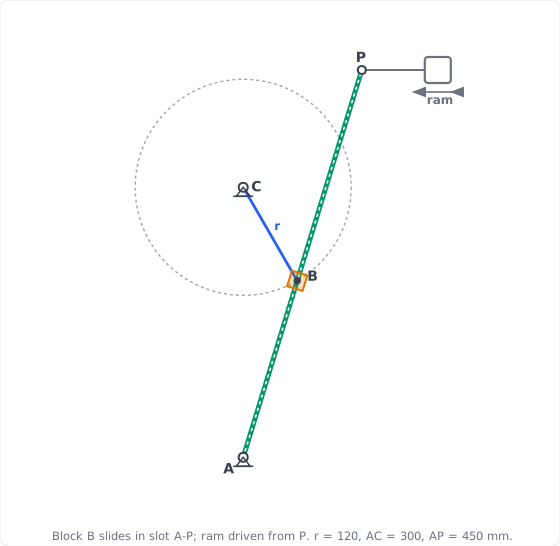
The block
Velocity of the block on the crank. Pick a pole
Direction of the coincident lever point.
Direction of the slip. The block slides along the slot, so
Close the polygon. The two construction lines meet at
Lever angular velocity.

From lever speed to ram speed. The driving point
The ram takes the horizontal part. The ram slides horizontally, so its speed is the horizontal component of
Analytical confirmation. Resolving the crank-pin velocity
Why it matters. The ram speed varies through the stroke, and it is deliberately low and steady over the cutting pass and high on the return. The acceleration analysis takes the next step: because the block slides while the lever turns, its acceleration carries a Coriolis term with no counterpart in the plain slider-crank. ✅
The whole lesson reduces to differentiating the loop and solving a linear system, which is a few lines of Python.
import numpy as np
def crank_slider_velocity(theta, r, l, omega):    """Piston velocity for an in-line slider-crank (e = 0)."""    phi = np.arcsin((r/l)*np.sin(theta))    return -r*omega*(np.sin(theta) + (r*np.sin(theta)*np.cos(theta))/(l*np.cos(phi)))
def four_bar_omega(a, b, c, theta2, theta3, theta4, omega2):    """Coupler and follower angular velocities from the velocity loop."""    w3 = a*omega2*np.sin(theta4 - theta2) / (b*np.sin(theta3 - theta4))    w4 = a*omega2*np.sin(theta2 - theta3) / (c*np.sin(theta4 - theta3))    return w3, w4
# Slider-crank: locate the peak (l/r = 3)r, l, omega = 0.050, 0.150, 1.0th = np.linspace(0, 2*np.pi, 100000)v = crank_slider_velocity(th, r, l, omega)i = np.argmax(np.abs(v))print(f"peak |Vp|/(r*omega) = {abs(v[i])/(r*omega):.3f} at {np.degrees(th[i]):.1f} deg")# peak |Vp|/(r*omega) = 1.055 at 73.2 deg
# Four-bar at theta2 = 60 deg (positions from the position analysis)w3, w4 = four_bar_omega(40, 120, 80, np.radians(60), np.radians(18.4), np.radians(64.9), 1.0)print(f"w3/w2 = {w3:.3f}, w4/w2 = {w4:.3f}") # w3/w2 = -0.040, w4/w2 = 0.457Differentiate, don't restart
Velocity equations are the time derivative of the position loop. Reuse the positions from the position analysis rather than setting up a new problem.
Find the real peak
Do not assume the maximum speed is at mid-stroke. The secondary harmonic shifts the peak, and components must be sized for the true maximum.
Draw first, then confirm
The velocity polygon gives the velocities geometrically and the velocity loop confirms them exactly. Two independent routes agreeing is your check that both are right.
Watch the limit positions
Where the velocity ratio approaches zero, mechanical advantage grows large. Place these positions deliberately, as in a toggle clamp.
| Mechanism | What you solve for | Key relation | Simulator |
|---|---|---|---|
| Slider-crank | piston velocity | exact: | siwit.co/CSM |
| Slider-crank | rod angular velocity | siwit.co/CSM | |
| Any pin joint | rubbing velocity | drawing | |
| Four-bar | velocity loop (linear) | siwit.co/FBL | |
| Scissor lift | platform velocity | siwit.co/SLM | |
| Toggle clamp | velocity ratio | siwit.co/TCM | |
| Quick-return (shaper) | ram velocity, slip | velocity polygon with slip vector | drawing |
Every velocity here was found by hand and reproduced with a few lines of Python (NumPy). The simulators confirm the same profiles interactively. No specialised motion software is involved; differentiating the loop is the whole method.
Next, Acceleration Analysis and Dynamic Forces differentiates once more. The velocity equations become acceleration equations, the piston acceleration reveals the primary and secondary inertia forces that shake an engine, and Newton’s second law turns those accelerations into the dynamic loads on bearings and links.
Comments