Every engineer debugs. Most engineers debug badly. Not because they lack technical skill, but because they skip the thinking step and go straight to changing things. Effective debugging is the scientific method in miniature: observe, hypothesize, predict, test, and update. If you can internalize this loop, you will find bugs faster, waste less time on dead ends, and build a reputation as the person who can figure out anything. #Debugging #ScientificMethod #CriticalThinking
Debugging IS the Scientific Method
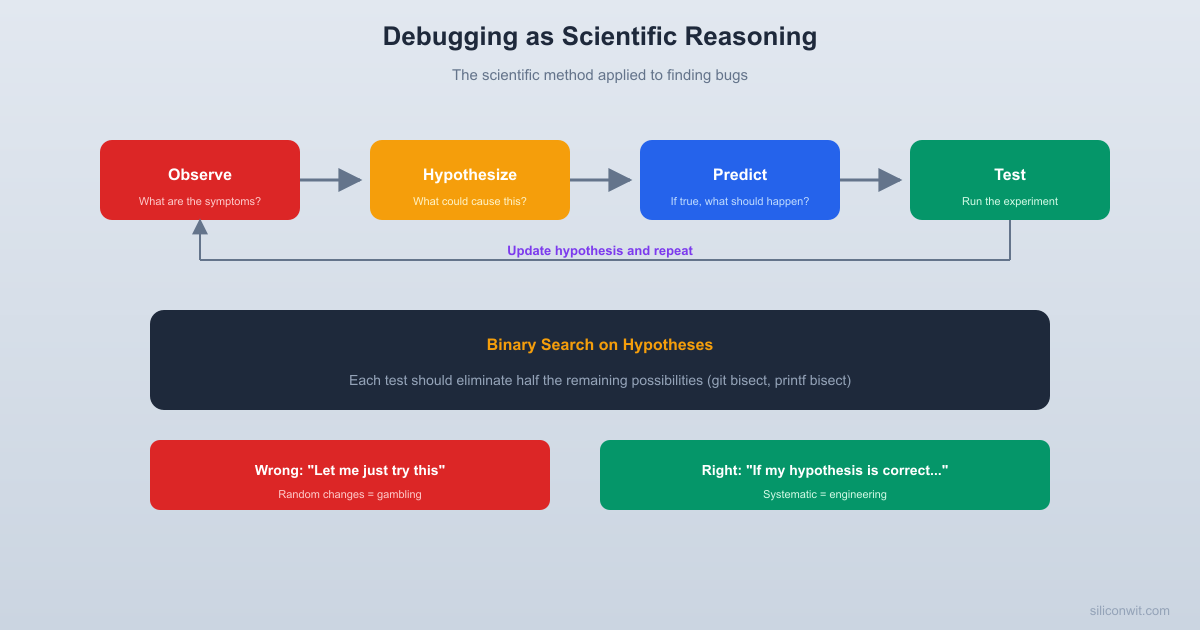
The scientific method is not just for labs and academic papers. It is a general-purpose reasoning tool for figuring out how things work (or why they do not). Debugging maps directly onto it:
Scientific Method
Debugging
Observe a phenomenon
Notice a symptom (crash, wrong output, slow performance)
Form a hypothesis
Propose a cause (“the null pointer comes from line 47”)
Make a prediction
”If the null pointer comes from line 47, adding a print before line 47 should show x is NULL”
Test the prediction
Add the print, run the program, check the output
Update the hypothesis
If x is not NULL, the null pointer comes from somewhere else
The critical insight is that you do not just “look for the bug.” You propose a specific explanation, derive a testable prediction from it, and run an experiment. If the prediction is wrong, you have learned something valuable: that particular hypothesis is incorrect, and you can move on.
Why This Matters
Random debugging, where you change things without a clear hypothesis, is like searching for your keys by wandering around randomly. Hypothesis-driven debugging is like systematically searching room by room, marking each room as “checked” when you are done. Both eventually find the keys, but one is dramatically faster.
The Debugging Loop
Here is the loop, spelled out as a concrete process:
Reproduce the bug. If you cannot reliably trigger the bug, you cannot test hypotheses about it. Spend time here first. Find the minimum set of inputs or conditions that trigger the problem.
Observe carefully. What exactly happens? Not “it crashes,” but “it crashes with a segfault at address 0x00000010 after processing the 47th record.” Details constrain your hypotheses.
Form a hypothesis. Based on the symptoms, propose a specific cause. “The 47th record in the test data has a field that is too long for the buffer allocated on line 203.”
Make a prediction. If your hypothesis is correct, what else should be true? “If the buffer overflow happens on long fields, then truncating all fields to 50 characters should prevent the crash.”
Test the prediction. Run the experiment. Did the crash stop when you truncated the fields?
Update and repeat. If yes, you have strong evidence for your hypothesis. Dig deeper to find the exact line. If no, your hypothesis is wrong. Form a new one based on what you have learned.
Writing It Down
Experienced debuggers often keep a debugging log, even if it is just a text file with timestamped notes. This serves several purposes:
It prevents you from going in circles (testing the same hypothesis twice).
It captures what you have ruled out, not just what you have found.
It helps you explain the debugging process to others.
It forces you to articulate your hypotheses clearly.
Binary Search: Divide and Conquer
One of the most powerful debugging techniques is binary search on the problem space. Instead of checking every possible cause sequentially, you cut the search space in half with each test.
Git Bisect
If your software worked in version 100 and is broken in version 200, the bug was introduced somewhere in those 100 commits. You could check each commit one by one (100 tests in the worst case). Or you could use binary search: test version 150. If it works, the bug is between 150 and 200. Test 175. And so on. You find the exact commit in about 7 tests instead of 100.
Terminal window
# Git has this built in
gitbisectstart
gitbisectbad# current version is broken
gitbisectgoodv1.0# this version was known good
# Git checks out the midpoint. You test and report:
gitbisectgood# or "git bisect bad"
# After ~7 steps, git tells you the exact commit
Printf Bisect
The same idea works for finding the location of a bug within a single file. If a function produces wrong output, add a print statement in the middle. Does the intermediate value look correct? If yes, the bug is in the second half. If no, it is in the first half. Keep subdividing.
Signal Chain Bisect
For hardware debugging, apply the same principle to the signal chain. If a sensor reading looks wrong at the output of your system, check the signal at the midpoint. Is the ADC output correct? If yes, the problem is in the software processing. If no, the problem is between the sensor and the ADC. Check the amplifier output next. Each measurement cuts the search space in half.
Network and Distributed Systems Bisect
In distributed systems, the same principle applies to the data path. If user input goes through a load balancer, then an API gateway, then a microservice, then a database, and the response is wrong, check the data at the midpoint. Is the microservice receiving the correct request? If yes, the problem is in the database query or response formatting. If no, the problem is upstream, in the gateway or load balancer.
The same technique works for debugging network issues. Can you ping the gateway? If yes, the problem is beyond the gateway. Can you reach the DNS server? If yes, the problem is not DNS. Each successful test eliminates half the network path.
The Power of Halving
Binary search is powerful because it scales logarithmically. For a problem with 1000 possible causes, sequential checking takes up to 1000 tests. Binary search takes about 10. For 1,000,000 possible causes, binary search takes about 20. Always ask: “Can I cut the problem space in half with a single test?”
Rubber Duck Debugging Is the Socratic Method
Rubber duck debugging, where you explain the problem out loud to an inanimate object, is one of the most effective debugging techniques ever discovered. It sounds silly, but it works because it forces you to do something you normally skip: examine your assumptions.
When the code is “just in your head,” you skip over the parts you think you understand. When you have to explain each line out loud (“and then this function returns the length of the string, which should be…wait, what if the string is null?”), you are forced to confront every assumption.
This is exactly what Socrates did with his students. He did not tell them the answer. He asked them to explain their reasoning step by step, and the flaws revealed themselves.
How to Rubber Duck Effectively
Open the relevant code or schematic.
Explain, out loud, what each part is supposed to do. Not what it does, but what it is supposed to do.
For each step, ask: “Is this actually true? What could go wrong here?”
When you hit a spot where you cannot confidently explain what happens, that is likely where the bug is.
The rubber duck does not even need to be a duck. Explain it to a colleague (they do not need to understand your codebase). Explain it to your dog. Write it as a comment in the code. The act of articulating forces clarity.
Why Writing Bug Reports Helps You Debug
Writing a clear bug report, even if nobody else will read it, forces the same kind of structured thinking as rubber duck debugging. A good bug report has:
What you expected to happen. This reveals your assumptions.
What actually happened. This forces you to observe precisely.
Steps to reproduce. This forces you to identify the minimum conditions.
What you have already tried. This prevents you from going in circles.
Many engineers have had the experience of writing a detailed bug report and realizing the answer halfway through. The act of writing is itself a debugging tool.
Common Debugging Fallacies
Engineers are human, and humans have predictable reasoning biases. Here are the ones that waste the most debugging time:
“The Compiler Has a Bug”
It Is Almost Never the Compiler
In decades of collective engineering experience, the compiler has been wrong perhaps a handful of times. When your code does something unexpected, the problem is in your code. The compiler is tested by millions of users and thousands of contributors. Your code was written by you, today, possibly while tired. Start with the assumption that your code is wrong.
”The Hardware Is Broken”
Similar to the compiler fallacy. Your microcontroller has been tested and qualified by a semiconductor company with billions of dollars of fabrication infrastructure. It is almost certainly not defective (unless you have physical damage from ESD or overheating). Your wiring, your pin assignments, your register configuration: those are where the bugs live.
”Someone Else’s Code Has a Bug”
If you are using a well-maintained library with thousands of users, and you just started using it today, the bug is in how you are using the library, not in the library itself. Read the documentation again. Check your function arguments. Look at the examples.
”It Worked Yesterday”
This is not a fallacy by itself, but it can lead you astray. The fact that it worked yesterday means something changed between yesterday and today. What changed? Did you update a dependency? Did the test data change? Did the environment change? “It worked yesterday” is actually valuable information because it narrows the search space to recent changes.
”It Should Not Be Possible”
When you say “this should not be possible,” what you really mean is “my mental model does not predict this.” The bug is in your mental model, not in reality. The system is doing exactly what you told it to do. You just told it to do something different from what you intended.
”I Did Not Change Anything”
This is almost never true. Something changed. Maybe you did not change the source code, but did you update a library? Did the operating system install an update overnight? Did the test data change? Did the network configuration change? Did someone else push a commit? Did the hardware age, a battery drain, or a connector corrode?
When you say “nothing changed,” what you usually mean is “nothing I am aware of changed.” The disciplined response is to systematically identify what could have changed, not to insist that nothing did.
Confirmation Bias in Debugging
Once you form a hypothesis about a bug, you tend to notice evidence that supports it and ignore evidence that contradicts it. You run a test that gives ambiguous results and interpret them as confirming your theory. Meanwhile, you overlook a log message that clearly points to a different cause.
The antidote is to actively try to disprove your hypothesis. Instead of asking “does this test confirm my theory?” ask “what test would disprove my theory?” If you cannot think of a test that would disprove it, your hypothesis is not specific enough to be useful.
Hypothesis-Driven vs. Random-Change Debugging
There is a temptation, especially when you are frustrated and tired, to just start changing things. “Let me try making this a static variable.” “What if I move this line above that line?” “Let me add a volatile keyword and see if that helps.”
This is not debugging. This is gambling. And like gambling, occasionally you win, which reinforces the bad habit.
You do not learn anything from changes that did not work.
If a change does “fix” the bug, you do not know why.
You might introduce new bugs with your random changes.
You waste time testing irrelevant hypotheses.
You cannot explain the fix to anyone else.
The fix might mask the real bug instead of solving it.
Every test eliminates at least one possible cause.
When you find the fix, you understand the root cause.
You make minimal changes, reducing the risk of new bugs.
You can explain the fix and teach others.
You can write a regression test because you understand the mechanism.
You build a mental model of the system that helps with future debugging.
When You Are Stuck
If you have been debugging for more than an hour and are not making progress, do one of these:
Take a break. Seriously. Walk away for 15 minutes. Your subconscious will keep working on the problem.
Explain the problem to someone else. Even if they know nothing about your system. The act of explaining often reveals the answer.
Question your assumptions. Write down everything you “know” about the bug. Then challenge each item. “I know the input is correct.” Are you sure? Have you printed it?
Start from scratch. Not on the code. On the debugging. Throw away your hypotheses and observe the symptoms with fresh eyes.
Root Cause vs. Workaround
Finding a workaround is not the same as finding the root cause. A workaround suppresses the symptom. A root cause fix eliminates the underlying problem.
Workaround
Root Cause Fix
Add a delay to avoid the race condition
Add a mutex to synchronize access
Restart the service every 4 hours before it crashes
Fix the memory leak
Catch the exception and retry
Fix the logic that throws the exception
Increase the timeout from 5s to 30s
Fix the slow query that causes the timeout
When Workarounds Are Acceptable
Workarounds get a bad reputation, but sometimes they are the right choice:
Time pressure. The production system is down and customers are affected. Apply the workaround now, fix the root cause later (but actually fix it later).
The root cause is in someone else’s code. If the bug is in a vendor library and they will not fix it for six months, a workaround in your code is reasonable.
The cost of the root cause fix exceeds the cost of the bug. If the race condition only triggers under conditions that never occur in production, a comment explaining the known issue might be better than a complex synchronization overhaul.
But always document workarounds. And always track the root cause fix as a separate task. Workarounds have a way of becoming permanent if you do not actively fight that tendency.
The Five Whys
The “Five Whys” technique, originally developed at Toyota, is a simple way to drill from a symptom to a root cause. You ask “why?” repeatedly until you reach a cause that, if fixed, would prevent the problem from recurring.
Why did the server crash? Because it ran out of memory.
Why did it run out of memory? Because the cache grew without bound.
Why did the cache grow without bound? Because there was no eviction policy.
Why was there no eviction policy? Because the cache was added as a quick optimization and nobody designed it properly.
Why was it not designed properly? Because there was no review process for performance optimizations.
The root cause is not “the server ran out of memory.” The root cause is “there was no review process for performance optimizations.” Fixing the cache eviction policy addresses the symptom. Fixing the review process prevents similar problems in the future.
You do not always need exactly five rounds. Sometimes three is enough. Sometimes seven is necessary. The point is to keep asking “why?” until you reach a cause that feels like a systemic fix rather than a patch.
War Stories: Debugging in the Real World
The Temperature-Dependent Bug
A team had a system that worked perfectly in the lab but failed in the field during summer months. They suspected a heat-related component failure and spent weeks testing components at elevated temperatures. The actual cause: the RTC backup battery was a lithium coin cell whose voltage dropped in high temperatures, causing the RTC to lose its configuration on warm mornings. The fix was a different battery chemistry with a flatter voltage curve.
The lesson: the hypothesis “heat damages the components” was reasonable but wrong. The actual mechanism was more subtle, involving a voltage threshold that shifted with temperature.
The Friday Afternoon Bug
A web service showed increased error rates every Friday afternoon. The team investigated caching, database load, and network congestion. The actual cause: a cron job ran every Friday at 2 PM to generate weekly reports, and it held a database lock that caused timeouts in the main application.
The lesson: timing patterns are powerful clues. If a bug correlates with a schedule, look for scheduled tasks.
The Works-In-Debug Bug
An embedded system worked perfectly when run in the debugger but crashed immediately when run standalone. The team suspected a timing issue (debuggers slow things down). The actual cause: the debugger initialized all RAM to zero on startup. The production system had random values in RAM at boot. A variable that should have been initialized to zero was not, and it only mattered when the random initial value was nonzero.
The lesson: “works in the debugger” is suspicious. Debuggers change the environment in ways that can mask bugs, especially initialization-related ones.
The Impossible Stack Trace
A team received crash reports from the field with a stack trace that pointed to a function that could not possibly crash. The function did simple arithmetic on local variables. No pointers, no memory allocation, no system calls. They spent days reviewing the function and found nothing wrong.
The actual cause: stack corruption from a buffer overflow in a completely different function. The overflow overwrote the return address on the stack, so when the corrupted function returned, execution jumped to a random location that happened to crash inside the innocent function. The stack trace was a red herring.
The lesson: stack traces are evidence, but they can be misleading when memory corruption is involved. If the stack trace does not make sense, consider whether the stack itself might be corrupted.
The Timing-Sensitive I2C Bug
A sensor read correctly 99% of the time but occasionally returned 0xFF on all bytes. The team added a retry loop, which “fixed” it. Months later, a customer reported that the sensor occasionally returned stale data (correct looking but outdated).
The actual cause: the I2C clock was slightly too fast for the sensor at elevated temperatures. At room temperature, the sensor’s setup time was barely met. At higher temperatures, the silicon slowed down just enough to miss the timing window. The sensor NAKed the transfer, but the driver did not check the ACK bit properly. The retry loop masked the NAK by simply reading again (successfully the second time), but it also masked the data staleness issue.
The lesson: retry loops are workarounds, not fixes. They mask the symptom without addressing the root cause, and they often introduce new, subtler problems.
Building a Debugging Toolkit
Beyond reasoning skills, effective debuggers have a toolkit of practical techniques they can reach for depending on the situation.
Minimizing the Reproduction Case
One of the most powerful techniques is reducing the problem to the smallest possible example that still exhibits the bug. If your 10,000-line application crashes, can you reproduce the crash in 100 lines? In 20 lines? The act of minimizing forces you to identify which parts of the system are relevant and which are not.
Every piece of code you remove without fixing the bug tells you something: that piece was not the cause. When you finally remove a piece and the bug disappears, you have found the critical component.
Delta Debugging
Delta debugging is the automated version of minimization. Given a failing input, it systematically removes portions of the input and checks whether the failure persists. After several rounds of removal, it produces a minimal failing input. This is particularly useful for compiler bugs, parser crashes, and any situation where you have a large input that triggers a failure.
Even without automation, you can apply the principle manually. Take your failing test case and start removing pieces. Cut it in half, test both halves, keep the half that fails, repeat.
The bug is intermittent and hard to reproduce under a debugger.
The system is distributed (multiple processes or machines).
Timing matters and a breakpoint would change the behavior.
You want a record of what happened for post-crash analysis.
The system is in production and you cannot attach a debugger.
The bug is easily reproducible.
You need to inspect complex data structures interactively.
You want to step through code line by line to understand control flow.
You need to modify variables at runtime to test hypotheses.
The call stack is important and you want to walk up and down it.
Experienced debuggers use both, often in combination. They add targeted logging to narrow down the location, then attach a debugger to examine the state in detail once they know where to look.
The Power of Assertions
Assertions are executable documentation of your assumptions. When you write assert(buffer != NULL), you are saying “I believe this pointer is never null at this point.” If you are wrong, the assertion fires immediately, pointing you directly at the violated assumption rather than letting the program crash mysteriously later.
The best time to add assertions is when you write the code, not when you are debugging. Every assumption you make about inputs, state, and invariants should be an assertion. They cost almost nothing at runtime (and can be compiled out in release builds), but they save enormous amounts of debugging time.
When to Ask for Help
There is a fine line between persistence and stubbornness. Knowing when to ask for help is as important as knowing how to debug.
After 30 minutes without progress, explain the problem to someone else (even a rubber duck). The act of explaining often unsticks you.
After 2 hours without progress, take a break. Walk, eat, sleep on it. Many bugs are solved in the shower or during a walk.
After half a day without progress, ask a colleague. Describe what you have tried, what you have ruled out, and what your current best hypothesis is. A fresh perspective is worth hours of solo debugging.
Before asking, make sure you can clearly articulate the problem, the symptoms, what you have tried, and what you expected. Vague requests like “it does not work, can you help?” waste everyone’s time.
Asking for help is not a sign of weakness. It is efficient use of a team’s collective knowledge. The best debuggers are not the ones who never ask for help. They are the ones who know when to ask and who bring a clear problem statement when they do.
Exercises
Practice the debugging loop. Write a simple program with a deliberate bug (off-by-one error, uninitialized variable, etc.). Give it to a colleague and ask them to debug it using the hypothesis-driven approach. Watch how they work. Do they form hypotheses? Do they make predictions? Or do they jump straight to changing code?
Git bisect exercise. Create a git repository with 20 commits. Introduce a bug in commit 10. Use git bisect to find the exact commit. How many steps did it take?
Challenge your assumptions. Take a piece of working code and list every assumption it makes (e.g., “the input file exists,” “the network is available,” “the timestamp is in UTC”). For each assumption, ask: “What happens if this is false?”
Debugging log. Next time you encounter a real bug, keep a written debugging log. Record each hypothesis, prediction, test, and result. After you find the bug, review your log. How many hypotheses did you test? How many were wrong? Did the log help you avoid going in circles?
Minimize a reproduction case. Take a program that has a known bug (or introduce one yourself). The program should be at least a few hundred lines. Try to reduce it to the smallest program that still exhibits the bug. Record how many removal steps you needed and what you learned at each step.
Five Whys. Take a recent bug from your work or a public post-mortem. Apply the Five Whys technique. What root cause do you arrive at? Is it a systemic issue (process, tooling, training) rather than a point failure (one developer made one mistake)?
Summary
Debugging is the scientific method applied to broken systems. The core loop is observe, hypothesize, predict, test, and update. Binary search cuts the problem space in half with each test, making it vastly more efficient than sequential checking. Rubber duck debugging forces you to examine assumptions you normally skip over. Common fallacies (blaming the compiler, blaming the hardware, making random changes) waste enormous amounts of time. The distinction between workarounds and root cause fixes matters for long-term system health. Building the habit of hypothesis-driven debugging makes you faster, more thorough, and better at explaining what went wrong and why.
Comments