RTOS bugs are uniquely frustrating because they depend on timing. A deadlock only triggers when two tasks acquire locks in a specific order. Priority inversion only surfaces under particular load conditions. A stack overflow might corrupt memory silently for hours before the system crashes. Printf debugging cannot capture these problems because adding print statements changes the timing and makes the bug disappear. In this lesson you will work through provided buggy firmware containing three planted defects and use professional tracing tools (Tracealyzer and SEGGER SystemView) to visualize exactly what each task is doing at microsecond resolution. #RTOSDebugging #Tracealyzer #SystemView
What We Are Building
RTOS Bug Hunt
Pre-written firmware with three deliberately planted bugs: (1) a deadlock caused by two tasks acquiring two mutexes in opposite order, (2) priority inversion where a low-priority task blocks a high-priority task through a shared resource, and (3) a stack overflow from a recursive parsing function. You will connect tracing tools, capture execution timelines, identify each bug from the trace data, and apply the correct fix.
Priority inversion (shared resource, no inheritance)
Bug 3
Stack overflow (recursive function exceeds stack)
Diagnostics
CPU load %, per-task stack high-water mark, queue fill level
Components
MCU board only (reuse existing hardware)
Parts List
Ref
Component
Quantity
Notes
U1
STM32 Blue Pill or ESP32 DevKit
1
Reuse from prior courses
-
ST-Link V2 or J-Link
1
For SWD trace capture (STM32)
-
USB cable
1
For serial monitor / ESP32 trace output
Why RTOS Bugs Are Different
Traditional embedded debugging relies on breakpoints and printf statements. Both approaches fail for RTOS problems. When you hit a breakpoint, the debugger pauses the entire processor, which means the scheduler stops, timer interrupts stop firing, and every task freezes simultaneously. A deadlock that depends on two tasks racing to acquire locks cannot be observed when both tasks are frozen. The bug only exists in the interaction between tasks, and the breakpoint destroys that interaction.
Printf debugging has a subtler problem. UART transmission takes real time. At 115200 baud, printing a 40-character status line takes about 3.5 ms. That is 3.5 ms during which the calling task holds the CPU (or blocks on UART), other tasks do not run, and the scheduler’s timing is completely different from the original code. The classic name for this is a Heisenberg bug: observing it changes the system enough to make it disappear. You add a printf, the deadlock stops happening, you remove the printf, the deadlock comes back.
  Deadlock: Two Mutexes, Opposite Order  ──────────────────────────────────────────  Task A                    Task B  ──────                    ──────  take(mutex_1) ✓           take(mutex_2) ✓  take(mutex_2) ← BLOCKED   take(mutex_1) ← BLOCKED       │                         │       └─── waiting for B ───────┘            B waiting for A            = DEADLOCK (both stuck forever)
  Fix: always acquire mutexes in the same order.
What you need instead is trace-based debugging. Trace tools record timestamped events (task switches, mutex takes, queue operations) into a RAM buffer with minimal overhead, typically a few microseconds per event. After the bug occurs, you examine the trace to see exactly which task did what and when. The system ran at nearly full speed, so the timing relationships that cause the bug are preserved in the recording.
FreeRTOS Runtime Statistics
FreeRTOS includes built-in profiling that measures how much CPU time each task consumes. This requires three configuration macros and a dedicated hardware timer.
The stats timer must tick faster than the RTOS tick (typically 1 kHz). A 10x to 100x factor gives good resolution. We will use TIM2 on the STM32 running at 100 kHz (10 us resolution).
Hardware Timer Setup (STM32)
/* stats_timer.c - TIM2 configured as a free-running 100 kHz counter */
#include"stm32f1xx.h"
voidvConfigureTimerForRunTimeStats(void) {
/* Enable TIM2 clock */
RCC->APB1ENR|= RCC_APB1ENR_TIM2EN;
/* 72 MHz / 720 = 100 kHz */
TIM2->PSC=720-1;
TIM2->ARR=0xFFFFFFFF; /* 32-bit counter, max reload */
The vTaskList() function produces a formatted table of all tasks in the system:
charlist_buf[512];
vTaskList(list_buf);
uart_send_string(list_buf);
Output:
Name State Prio Stack Num
IDLE R 0 112 4
Monitor B 1 198 3
SensorRead B 2 156 1
DataProcess B 2 134 2
Tmr Svc B 2 220 5
Each column provides diagnostic information:
Column
Meaning
Name
Task name (set at xTaskCreate)
State
R = Running, B = Blocked, S = Suspended, D = Deleted
Prio
Current priority (may differ from base if inheritance is active)
Stack
High-water mark in words (minimum free stack ever observed)
Num
Task number assigned at creation
The Stack column is particularly important. It shows the minimum number of free stack words the task has ever had. If this number approaches zero, the task is close to overflowing its stack. A common rule of thumb: if the high-water mark drops below 20% of the total stack allocation, increase the stack size.
SEGGER SystemView
SEGGER SystemView is a free real-time analysis tool that visualizes task execution, interrupts, and RTOS API calls on a timeline. It works by intercepting FreeRTOS trace hook macros, writing compact binary events into a ring buffer in RAM, and streaming that buffer to the host PC via a J-Link debug probe or UART.
How It Works
FreeRTOS calls trace hook macros at every context switch, mutex take/give, queue send/receive, and other kernel events.
The SEGGER SystemView recorder library encodes each event as a compact binary packet (typically 4 to 12 bytes) with a high-resolution timestamp.
Events accumulate in a ring buffer in target RAM (typically 1 to 4 KB).
The J-Link reads this buffer continuously via SWD without halting the CPU. Alternatively, a UART streaming mode sends events over serial.
The SystemView PC application decodes the stream and renders interactive timelines.
Setup Steps
Download SEGGER SystemView from segger.com/systemview. The target-side source files are included in the download.
Copy the following files into your project:
SEGGER_SYSVIEW.c and SEGGER_SYSVIEW.h (core recorder)
SEGGER_RTT.c and SEGGER_RTT.h (Real-Time Transfer for J-Link communication)
In FreeRTOSConfig.h, include the trace hook header at the end of the file (after all other defines):
/* Must be last in FreeRTOSConfig.h */
#include"SEGGER_SYSVIEW_FreeRTOS.h"
This header redefines traceTASK_SWITCHED_IN(), traceTASK_SWITCHED_OUT(), traceBLOCKING_ON_QUEUE_RECEIVE(), and dozens of other hooks to call SystemView recording functions.
In your main(), call SEGGER_SYSVIEW_Conf() before starting the scheduler:
Connect the J-Link to SWD (SWDIO and SWCLK pins on the Blue Pill). Open the SystemView application on your PC, click Start Recording, and select the J-Link connection.
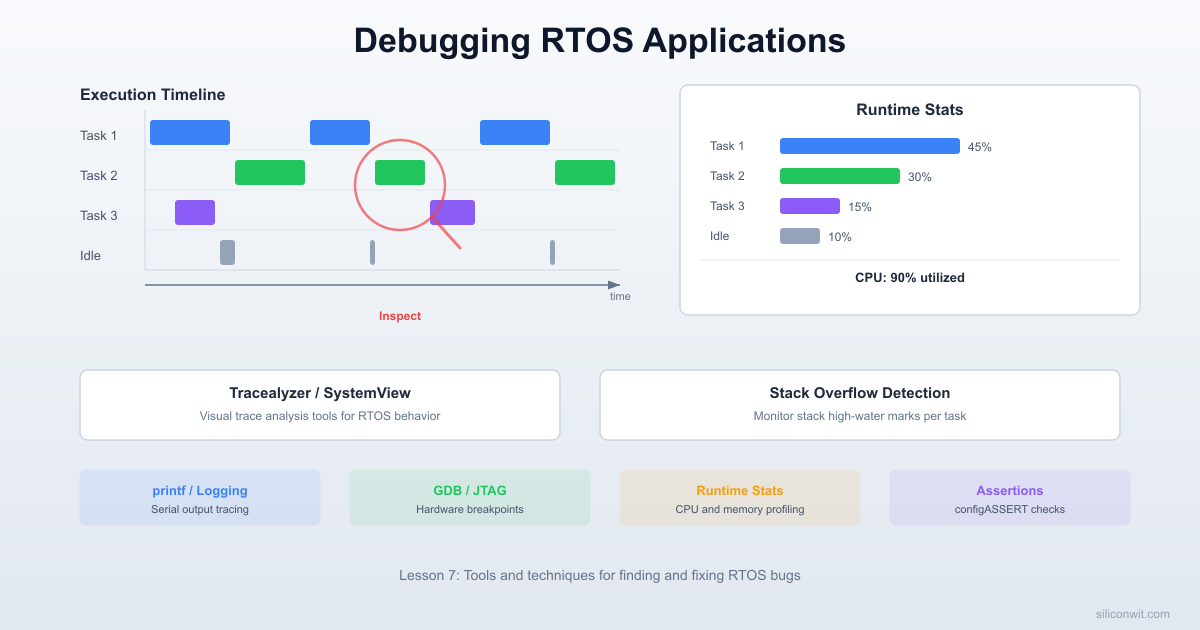
The SystemView timeline shows colored bars for each task. When a task is running, its bar is solid. When it blocks on a mutex or queue, you see a gap with an annotation showing which object it is waiting on. Context switches appear as vertical lines where one task’s bar ends and another begins. This view makes deadlocks immediately visible: two tasks both show “blocked on mutex” at the same time, and neither ever resumes.
Tracealyzer
Percepio Tracealyzer is another professional trace analysis tool. It offers a free evaluation license and provides similar timeline visualization with additional views like CPU load graphs, communication flow diagrams, and statistical analysis of response times.
Snapshot Mode vs. Streaming Mode
Mode
How it works
Pros
Cons
Snapshot
Trace events fill a RAM buffer. You halt the CPU (or trigger a dump), then Tracealyzer reads the buffer
No special hardware needed, works with any debugger
Only captures the last N events, may miss the moment the bug occurred
Streaming
Events stream continuously to the host via J-Link, UART, or TCP/IP (on ESP32)
Captures everything, can record for minutes or hours
Requires a fast link, may lose events if the link is too slow
Setup Overview
Download Tracealyzer from percepio.com. Request a free evaluation license.
Copy the Tracealyzer recorder library (TraceRecorder/) into your project. The key files are trcRecorder.c, trcRecorder.h, and the configuration file trcConfig.h.
In trcConfig.h, configure the recorder for FreeRTOS:
In FreeRTOSConfig.h, include the Tracealyzer header (similar to SystemView, this redefines the trace hooks):
/* Must be last in FreeRTOSConfig.h */
#include"trcRecorder.h"
Initialize the recorder before starting the scheduler:
xTraceEnable(TRC_START);
vTaskStartScheduler();
For snapshot mode, halt the CPU after the bug occurs, then use Tracealyzer’s “Read Trace” to extract the buffer from RAM via your debugger.
Both SystemView and Tracealyzer provide the same fundamental capability: non-intrusive recording of RTOS events with microsecond timestamps. Choose whichever is more convenient for your hardware setup. If you have a J-Link, SystemView is the easiest path. If you only have an ST-Link, Tracealyzer’s snapshot mode works well.
The Bug Hunt
Now for the core of this lesson. Below are three buggy code patterns. Each one compiles and runs, but fails under specific conditions. For each bug, you will see the buggy code, the symptom, what a trace reveals, and the fix.
Bug 1: Deadlock
Two tasks share two resources (a UART port and a shared data buffer), each protected by its own mutex. Task A acquires the UART mutex first, then the buffer mutex. Task B acquires them in the opposite order. Under the right timing, both tasks acquire one mutex each and block forever waiting for the other.
Buggy code:
staticSemaphoreHandle_t xMutexUART;
staticSemaphoreHandle_t xMutexBuffer;
staticcharshared_buffer[128];
/* Task A: read sensor, format into buffer, send over UART */
Symptom: The system runs for a few seconds (sometimes minutes), then all serial output stops. The LED heartbeat (if you have one) also stops because the scheduler is still running but both tasks are permanently blocked.
What the trace reveals: In SystemView or Tracealyzer, you see Task A successfully take xMutexUART, then a context switch to Task B, which successfully takes xMutexBuffer. Task B then attempts to take xMutexUART and blocks. Task A resumes and attempts to take xMutexBuffer and blocks. From this point forward, neither task ever runs again. The trace shows two “Blocked on Mutex” events that never resolve.
Fix: Consistent lock ordering. Always acquire mutexes in the same order everywhere in your codebase. Define a global ordering (e.g., UART before Buffer) and follow it in every task:
/* Task B: FIXED - acquire in same order as Task A */
staticvoidvTaskB_Fixed(void*pvParameters) {
for (;;) {
/* Lock UART first, then buffer (SAME ORDER as Task A) */
A high-priority task and a low-priority task share a resource. The low-priority task acquires a binary semaphore (which has no priority inheritance), holds it while doing slow work, and a medium-priority task preempts the low-priority task. The high-priority task is starved because it is waiting for the semaphore that the low-priority task holds, but the low-priority task cannot release it because the medium-priority task keeps preempting it.
Buggy code:
/* BUG: Using binary semaphore instead of mutex for mutual exclusion */
xSemaphoreGive(xResourceLock); /* Start in "available" state */
Symptom: The high-priority task reports wait times of 100+ ms instead of the expected 50 ms maximum. Serial output shows erratic, long delays.
What the trace reveals: The trace timeline shows the low-priority task acquire the semaphore, then the medium-priority task preempts it (because medium > low). The medium-priority task runs for a long burst. Meanwhile the high-priority task wakes, tries to take the semaphore, and blocks. The high-priority task cannot run because the semaphore is held by the low-priority task. The low-priority task cannot run because the medium-priority task is preempting it. The medium-priority task does not even use the resource. The result: the highest-priority task in the system is effectively running at the lowest priority.
Fix: Use xSemaphoreCreateMutex() instead of xSemaphoreCreateBinary(). FreeRTOS mutexes include priority inheritance. When the high-priority task blocks on a mutex held by the low-priority task, the kernel temporarily raises the low-priority task to the high-priority level. This lets it finish and release the mutex before the medium-priority task can preempt it:
/* FIXED: mutex with priority inheritance */
xResourceLock =xSemaphoreCreateMutex();
No other code changes are needed. The xSemaphoreTake and xSemaphoreGive API is identical for binary semaphores and mutexes. Only the creation function differs. After this fix, the trace shows the low-priority task’s priority temporarily elevated to 3 while it holds the mutex, allowing it to complete without being preempted by the medium-priority task.
Bug 3: Stack Overflow
A task parses JSON-formatted configuration strings using a recursive descent parser. The stack usage depends on the nesting depth of the input. Small inputs work fine, but a deeply nested configuration string overflows the task’s stack.
Buggy code:
/* Recursive JSON-ish parser (simplified for demonstration) */
staticintparse_value(constchar**pp, intdepth);
staticintparse_object(constchar**pp, intdepth) {
charlocal_buf[32]; /* 32 bytes of stack per recursion level */
if (**pp !='{') return-1;
(*pp)++;
while (**pp &&**pp !='}') {
/* Skip to value */
while (**pp &&**pp !=':') (*pp)++;
if (**pp ==':') (*pp)++;
/* Copy key name into local buffer */
int i =0;
while (**pp &&**pp !=','&&**pp !='}'
&&**pp !='{'&& i <31) {
local_buf[i++] =*(*pp)++;
}
local_buf[i] ='\0';
/* Recurse into nested objects */
if (**pp =='{') {
parse_value(pp, depth +1);
}
if (**pp ==',') (*pp)++;
}
if (**pp =='}') (*pp)++;
return0;
}
staticintparse_value(constchar**pp, intdepth) {
if (depth >50) return-1; /* Safety limit, but too late */
Symptom: The system runs for one iteration, parses the small input successfully, then crashes on the deep input. If configCHECK_FOR_STACK_OVERFLOW is enabled, you see the stack overflow hook fire. Without it, you get a hard fault or random memory corruption.
What the trace reveals: The trace shows the Parser task running, then a sudden stop or a hard fault exception. The vTaskList() output taken before the crash shows the Parser task’s stack high-water mark at 12 words (48 bytes free), which is dangerously close to zero. After increasing nesting, the stack is fully consumed.
Fix: Two options, from best to easiest:
Option A: Remove recursion. Replace the recursive parser with an iterative one that uses an explicit stack on the heap:
/* Iterative parser with explicit stack */
#defineMAX_DEPTH32
staticintparse_iterative(constchar*input) {
int depth =0;
constchar*p = input;
while (*p) {
if (*p =='{') {
depth++;
if (depth > MAX_DEPTH) return-1;
} elseif (*p =='}') {
depth--;
}
p++;
}
return (depth ==0) ?0:-1;
}
Option B: Increase the stack. If the recursive structure is necessary, allocate a larger stack:
/* 512 words = 2048 bytes, enough for ~20 levels of nesting */
Method 2 (configCHECK_FOR_STACK_OVERFLOW = 2) writes a known pattern to the end of the stack and checks whether it has been overwritten. This catches most overflows but adds a small overhead to each context switch.
Complete Buggy Firmware
This firmware contains all three bugs, controlled by conditional compilation. Enable one #define at a time to reproduce each bug independently. A monitoring task prints runtime statistics and task stack levels so you can observe the symptoms.
Note that ESP32 stack sizes are in bytes (not words), so 2048 bytes replaces the STM32’s 256 words (1024 bytes). The Parser task uses 1024 bytes on ESP32 to trigger the same overflow scenario.
The Fixed Firmware
Here is the corrected version with all three bugs fixed. Each fix is marked with a comment explaining the change.
In production firmware, you want continuous health monitoring rather than manual inspection. The following pattern creates a watchdog-style task that periodically checks per-task CPU usage and raises an alert if any task exceeds its budget.
/* cpu_monitor.c - Per-task CPU load monitoring */
#include"FreeRTOS.h"
#include"task.h"
#include<stdio.h>
#include<string.h>
#defineMAX_TASKS16
#defineCPU_CHECK_PERIOD_MS5000
#defineCPU_WARN_THRESHOLD30 /* Warn if a task exceeds 30% CPU */
staticTaskStatus_ttask_status_array[MAX_TASKS];
staticvoidvCpuMonitorTask(void*pvParameters) {
uint32_t total_runtime;
charbuf[80];
for (;;) {
vTaskDelay(pdMS_TO_TICKS(CPU_CHECK_PERIOD_MS));
UBaseType_t task_count =uxTaskGetSystemState(
task_status_array, MAX_TASKS, &total_runtime
);
if (total_runtime ==0) continue; /* Avoid division by zero */
If the IDLE percentage drops below 50%, your system is running hot. If it drops below 10%, you are likely missing deadlines and should either optimize task code or move to a faster processor.
/* Include trace hooks (uncomment ONE of these): */
/* #include "SEGGER_SYSVIEW_FreeRTOS.h" */
/* #include "trcRecorder.h" */
PlatformIO Configuration
; platformio.ini
[env:bluepill]
platform = ststm32
board = bluepill_f103c8
framework = stm32cube
build_flags =
-DUSE_HAL_DRIVER
-DSTM32F103xB
[env:esp32]
platform = espressif32
board = esp32dev
framework = espidf
Experiments
Add a Queue Overflow Bug
Add a fourth bug to the firmware: a producer task that sends to a queue faster than the consumer reads. Use uxQueueMessagesWaiting() in the monitor task to display fill level over time. Implement a fix using either a deeper queue or a timeout on xQueueSend that discards stale data.
Implement a Watchdog Timer
Add a software watchdog using a FreeRTOS timer. Each critical task must call a “check-in” function every N milliseconds. If any task misses its deadline, the watchdog prints which task is hung and optionally triggers a system reset. Test it by deliberately creating a deadlock and verifying the watchdog catches it.
SystemView Streaming over UART
If you do not have a J-Link, configure SEGGER SystemView to stream events over UART instead of RTT. Replace the RTT up-buffer write function with a UART transmit. Connect to SystemView on the PC using the UART recording mode. Compare the overhead of UART streaming vs. RTT (J-Link) streaming.
Profile Interrupt Latency
Configure a GPIO interrupt (button press) and measure the time from the interrupt trigger to the start of the ISR using the stats timer. Log the latency over 1000 interrupts and compute the min, max, and average. Then add a long critical section (taskENTER_CRITICAL) in another task and observe how it increases worst-case interrupt latency.
Comments