Individual subsystems that work perfectly in isolation have a habit of falling apart when combined. A broker that handles three test clients chokes when TLS, Telegraf, Node-RED, and a Flask API all compete for connections. A dashboard that looks great on synthetic data shows nothing when real sensor payloads arrive with unexpected field names. Production readiness means every component has been tested together, failures are detected automatically, and the system recovers without human intervention. This capstone pulls together protocol selection, broker configuration, multi-MCU MQTT clients, time-series storage, REST APIs, alert automation, and device security into a single greenhouse monitoring deployment with three sensor nodes, live Grafana dashboards, Slack alerts, and cloud forwarding to SiliconWit.io. #IoT #Production #Capstone
  Production System Health Monitoring  ──────────────────────────────────────────  Normal Operation:  Node 1: ✓ online   25.3C   62% RH  Node 2: ✓ online   24.8C   58% RH  Node 3: ✓ online   26.1C   AQI 42
  Failure Detection:  Node 2: ✗ offline  (no msg in 5 min)    │    ├──► Grafana: panel turns RED    ├──► Node-RED: status alert fires    ├──► Slack: "Node 2 offline at 03:12"    └──► Escalation: SMS after 15 min
Docker Compose Service Map
──────────────────────────────────────────
docker-compose.yml
┌─────────────────────────────────────┐
│ mosquitto :1883, :8883 (TLS) │
│ telegraf (internal, no port) │
│ influxdb :8086 │
│ grafana :3000 │
│ nodered :1880 │
│ flask-api :5000 │
└─────────────────────────────────────┘
│
Shared Docker network: iot-net
Services reference each other by name:
telegraf ──► mosquitto (mqtt://mosquitto)
telegraf ──► influxdb (http://influxdb)
grafana ──► influxdb (http://influxdb)
nodered ──► mosquitto (mqtt://mosquitto)
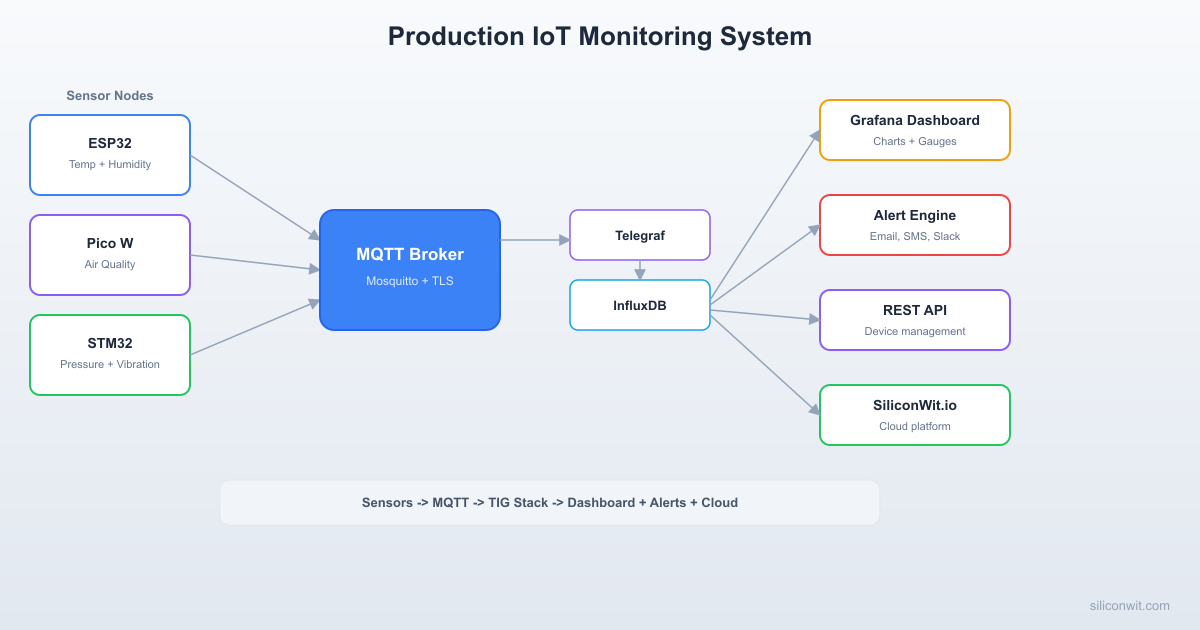
System Overview
The system monitors a greenhouse environment using three sensor nodes, each running on a different MCU platform. All data flows through a central Mosquitto broker secured with TLS and per-device credentials. Telegraf subscribes to MQTT topics and writes readings into InfluxDB. Grafana queries InfluxDB and renders live dashboards. A Flask REST API provides device listing, data queries, and command dispatch. Node-RED handles automation rules and alert routing. The Mosquitto broker also bridges selected topics to SiliconWit.io, giving you a cloud mirror of your data that remains accessible even when your local infrastructure is down.
Reads BME280 (temperature, humidity, pressure) and a capacitive soil moisture sensor. Publishes every 30 seconds with QoS 1. Implements exponential backoff on reconnection and buffers up to 60 readings in RTC memory when offline. Skills from: Lesson 3 (MQTT clients), ESP32 Course (peripherals, deep sleep).
Sensor Node B: Pico W
Reads an LDR light sensor via ADC and a PIR motion sensor via GPIO interrupt. Publishes light level every 30 seconds and motion events on change (edge triggered). Skills from: Lesson 3 (MQTT clients), RPi Pico Course (GPIO, ADC).
Sensor Node C: STM32 + ESP-01
Reads an MQ-135 air quality sensor via ADC. Publishes air quality index every 30 seconds. The STM32 communicates with the ESP-01 over UART using AT commands. Skills from: Lesson 3 (MQTT clients), STM32 Course (UART, ADC).
Mosquitto Broker
TLS 1.2 with server certificates, password authentication, topic ACLs that restrict each device to its own publish prefix, persistent sessions, and an MQTT bridge that forwards all sensor data to SiliconWit.io. Skills from: Lesson 2 (broker setup), Lesson 7 (TLS and security).
Telegraf + InfluxDB
Telegraf subscribes to greenhouse/# and writes every message into an InfluxDB bucket with 30-day retention. InfluxDB provides the query engine for both Grafana and the REST API. Skills from: Lesson 4 (dashboards and data).
Grafana Dashboard
Panels for temperature, humidity, pressure, soil moisture, light, motion events, air quality, device online/offline status, and alert history. Auto-refreshes every 10 seconds. Skills from: Lesson 4 (dashboards and data).
Flask REST API
Endpoints for listing devices, querying historical data, and dispatching commands to nodes (such as changing the publish interval). Secured with API keys. Skills from: Lesson 5 (REST APIs and webhooks).
Node-RED Alerts
Threshold alerts (temperature above 35C, humidity below 20%), inactivity alerts (no data from a node for 5 minutes), and notifications via Slack webhook. Skills from: Lesson 6 (alerts and automation).
SiliconWit.io Cloud
Data forwarded via MQTT bridge appears on SiliconWit.io dashboards automatically. Students can monitor their greenhouse remotely even when the local Grafana instance is unreachable. Skills from: Lesson 2 (broker bridging).
MQTT Topic Hierarchy
A well-structured topic hierarchy keeps the system organized and makes ACLs straightforward. Every sensor node publishes under greenhouse/<node-id>/, and status topics use retained messages with last will.
greenhouse/stm32-node/status "online" (retained, last will: "offline")
greenhouse/cmd/[node-id] (commands from API)
Design decisions:
Retained messages on all sensor topics so that any new subscriber (Telegraf restarting, a new dashboard panel) immediately gets the last known value.
QoS 1 for all publishes. QoS 0 risks silent data loss; QoS 2 adds round trips without meaningful benefit for sensor data where occasional duplicates are harmless.
Per-node prefixes make ACLs simple: each device credential is allowed to publish only under its own prefix.
Command topics use greenhouse/cmd/<node-id> so the REST API can dispatch configuration changes to specific nodes.
Broker Configuration
Mosquitto with TLS and ACLs
The broker runs in a Docker container with TLS certificates, password authentication, and topic ACLs. This configuration was introduced in Lesson 2 and hardened in Lesson 7.
mosquitto/mosquitto.conf
# Listener with TLS
listener 8883
certfile /mosquitto/certs/server.crt
keyfile /mosquitto/certs/server.key
cafile /mosquitto/certs/ca.crt
# Authentication
allow_anonymous false
password_file /mosquitto/config/passwd
# Access control
acl_file /mosquitto/config/acl
# Persistence
persistence true
persistence_location /mosquitto/data/
# Logging
log_dest file /mosquitto/log/mosquitto.log
log_type all
# Bridge to SiliconWit.io
connection siliconwit-bridge
address mqtt.siliconwit.io:8883
bridge_cafile /mosquitto/certs/siliconwit-ca.crt
remote_username YOUR_SILICONWIT_USERNAME
remote_password YOUR_SILICONWIT_TOKEN
topic greenhouse/# out 1
bridge_protocol_version mqttv311
bridge_insecure false
start_type automatic
notifications true
notification_topic greenhouse/bridge/status
ACL File
mosquitto/acl
# ESP32 node: publish to its own topics, subscribe to commands
user esp32-node
topic write greenhouse/esp32-node/#
topic read greenhouse/cmd/esp32-node
# Pico W node: publish to its own topics, subscribe to commands
user pico-node
topic write greenhouse/pico-node/#
topic read greenhouse/cmd/pico-node
# STM32 node: publish to its own topics, subscribe to commands
user stm32-node
topic write greenhouse/stm32-node/#
topic read greenhouse/cmd/stm32-node
# Telegraf: read all greenhouse data
user telegraf
topic read greenhouse/#
# API server: read all data, write commands
user api-server
topic read greenhouse/#
topic write greenhouse/cmd/#
# Node-RED: read all data
user nodered
topic read greenhouse/#
Password File
Generate the password file with mosquitto_passwd:
Generate credentials
# Create the password file (first user, -c creates the file)
mosquitto_passwd-cmosquitto/passwdesp32-node
# Add remaining users (no -c, appends to file)
mosquitto_passwdmosquitto/passwdpico-node
mosquitto_passwdmosquitto/passwdstm32-node
mosquitto_passwdmosquitto/passwdtelegraf
mosquitto_passwdmosquitto/passwdapi-server
mosquitto_passwdmosquitto/passwdnodered
Node Firmware
ESP32 Node (BME280 + Soil Moisture)
This node reads temperature, humidity, and pressure from a BME280 over I2C, and soil moisture from a capacitive sensor on ADC. It publishes every 30 seconds with QoS 1. If the MQTT connection drops, it buffers readings in a ring buffer and publishes them when the connection recovers. Reconnection uses exponential backoff starting at 1 second and capping at 60 seconds (Lesson 3 pattern).
Exponential backoff on disconnect (1s, 2s, 4s, … up to 60s)
Offline ring buffer so readings are not lost during network outages
Buffer flush on reconnection, with a small delay between publishes to avoid flooding
Last will message set to “offline” so the broker notifies all subscribers if the node vanishes
Retained messages on all sensor topics so new subscribers get immediate data
Pico W Node (Light + PIR Motion)
The Pico W reads ambient light from an LDR on ADC0 and detects motion from a PIR sensor on GPIO 15. Light level is published every 30 seconds. Motion events are published on change only (edge triggered), reducing unnecessary traffic.
pico_node/main.py
import network
import time
import json
from machine import Pin, ADC
from umqtt.simple import MQTTClient
# Configuration
WIFI_SSID="your_ssid"
WIFI_PASS="your_password"
BROKER_IP="192.168.1.100"
BROKER_PORT=8883
MQTT_USER="pico-node"
MQTT_PASS="your_password_here"
CLIENT_ID="pico-greenhouse"
PUBLISH_INTERVAL=30# seconds
# Topics
TOPIC_LIGHT=b"greenhouse/pico-node/light"
TOPIC_MOTION=b"greenhouse/pico-node/motion"
TOPIC_STATUS=b"greenhouse/pico-node/status"
TOPIC_CMD=b"greenhouse/cmd/pico-node"
# Hardware
ldr =ADC(Pin(26)) # ADC0, GP26
pir =Pin(15, Pin.IN) # PIR sensor on GP15
led =Pin("LED", Pin.OUT) # Onboard LED for status
# State
last_motion =0
backoff_s =1
MAX_BACKOFF=60
defconnect_wifi():
wlan = network.WLAN(network.STA_IF)
wlan.active(True)
ifnot wlan.isconnected():
print("Connecting to Wi-Fi...")
wlan.connect(WIFI_SSID, WIFI_PASS)
timeout =20
whilenot wlan.isconnected() and timeout >0:
time.sleep(1)
timeout -=1
if wlan.isconnected():
print("Wi-Fi connected:", wlan.ifconfig())
led.on()
returnTrue
else:
print("Wi-Fi connection failed")
led.off()
returnFalse
defread_light_lux():
"""Read LDR and convert ADC value to approximate lux."""
raw = ldr.read_u16() # 0-65535
# Simple linear mapping (calibrate for your LDR + resistor divider)
time.sleep(0.1) # Small poll interval for responsive motion detection
exceptExceptionas e:
print("MQTT error:", e)
client =None# Force reconnect on next loop
main()
STM32 Node (Air Quality via ESP-01)
The STM32 reads an MQ-135 air quality sensor on its ADC and sends MQTT publishes through an ESP-01 module connected over UART. This uses AT commands to control the ESP-01 (the same pattern from the STM32 course). The firmware is written for STM32 HAL.
Telegraf subscribes to all greenhouse/# topics and writes each message into InfluxDB. This was covered in Lesson 4. Here is the full configuration for the production system.
telegraf/telegraf.conf
# Global agent configuration
[agent]
interval = "10s"
round_interval = true
flush_interval = "10s"
flush_jitter = "2s"
# MQTT consumer input
[[inputs.mqtt_consumer]]
servers = ["ssl://mosquitto:8883"]
topics = ["greenhouse/#"]
username = "telegraf"
password = "your_telegraf_password"
client_id = "telegraf-greenhouse"
qos = 1
persistent_session = true
# TLS configuration
tls_ca = "/etc/telegraf/certs/ca.crt"
insecure_skip_verify = false
# Parse topic to extract node and metric
# Topic format: greenhouse/<node>/<metric>
[[inputs.mqtt_consumer.topic_parsing]]
topic = "greenhouse/+/+"
measurement = "measurement/_/_"
tags = "_/node/metric"
# Data format: plain string values
data_format = "value"
data_type = "float"
# InfluxDB v2 output
[[outputs.influxdb_v2]]
urls = ["http://influxdb:8086"]
token = "your_influxdb_token"
organization = "greenhouse"
bucket = "sensor_data"
# Tag filtering
[outputs.influxdb_v2.tagpass]
node = ["esp32-node", "pico-node", "stm32-node"]
InfluxDB Bucket Configuration
Create bucket with 30-day retention
# Using the InfluxDB CLI inside the container
influxbucketcreate\
--namesensor_data\
--orggreenhouse\
--retention30d
# Verify the bucket
influxbucketlist--orggreenhouse
The 30-day retention policy means InfluxDB automatically deletes data older than 30 days. For long-term storage, you can create a second bucket with longer retention and a downsampling task that writes hourly averages to it.
Downsampling task (optional, for long-term storage)
The Grafana dashboard has panels organized into rows: one row per sensor node, plus a system health row.
Dashboard JSON (Key Panels)
Rather than listing the entire JSON, here are the Flux queries for each major panel. Import these into Grafana by creating a new dashboard and adding panels with InfluxDB (Flux) as the data source.
The Flask API provides programmatic access to the system (Lesson 5 pattern). It queries InfluxDB for historical data and publishes commands to the broker for device control.
Node-RED handles threshold alerts and inactivity detection (Lesson 6). The alert flow subscribes to all greenhouse topics and evaluates rules on every message.
Threshold Alerts
Condition
Severity
Action
Temperature > 35 C
Critical
Slack notification + Grafana annotation
Temperature < 5 C
Critical
Slack notification + Grafana annotation
Humidity < 20%
Warning
Slack notification
Humidity > 90%
Warning
Slack notification
Soil moisture < 15%
Warning
Slack notification (“water the plants”)
Air quality (AQI) > 150
Critical
Slack notification (“ventilation needed”)
Inactivity Alerts
If no data arrives from a node for 5 minutes, Node-RED fires an inactivity alert. This catches scenarios where a node crashes silently without the MQTT last will firing (for example, if the node loses Wi-Fi but the TCP connection has not yet timed out at the broker).
"func": "const ctx = global.get('lastSeen') || {};\nconst now = Date.now();\nconst threshold = 5 * 60 * 1000; // 5 minutes\nconst nodes = ['esp32-node', 'pico-node', 'stm32-node'];\nconst alerts = [];\n\nfor (const node of nodes) {\n const lastSeen = ctx[node];\n if (!lastSeen || (now - lastSeen) > threshold) {\n alerts.push(node);\n }\n}\n\nif (alerts.length > 0) {\n msg.payload = {\n text: `INACTIVITY ALERT: No data received from ${alerts.join(', ')} for over 5 minutes. Check device connectivity.`\n };\n return msg;\n}\nreturn null;"
}
]
Alert Deduplication
To avoid alert storms (the same threshold firing every 30 seconds), add a rate limiter in each alert function. The pattern stores the last alert timestamp and suppresses duplicates within a cooldown window.
All backend services run in Docker containers. This makes deployment reproducible and portable. Podman (fully open source, rootless, no daemon, no paid tiers) works as an alternative, though some inter-container networking and health check features may need minor adjustments with podman-compose.
Generate TLS certificates.
Use the certificate generation process from Lesson 7. Create a CA, then sign server and client certificates. Place all certificates in the certs/ directory.
Generate Mosquitto passwords.
Run the mosquitto_passwd commands shown earlier to create credentials for all six users (three sensor nodes, Telegraf, the API server, and Node-RED).
Configure your SiliconWit.io bridge credentials.
Log in to siliconwit.io, create a device, and copy the MQTT username and token into mosquitto.conf under the bridge section.
Start the Docker stack.
Terminal window
dockercomposeup-d
Wait for all containers to reach a healthy state:
Terminal window
dockercomposeps
Verify the broker is running.
Terminal window
mosquitto_sub-hlocalhost-p8883\
--cafilecerts/ca.crt\
-utelegraf-Pyour_telegraf_password\
-t"greenhouse/#"-v
Leave this running in a terminal. You should see messages appear once sensor nodes connect.
Flash the ESP32 node.
Build and flash using ESP-IDF:
Terminal window
cdfirmware/esp32_node
idf.pyset-targetesp32
idf.pybuild
idf.pyflashmonitor
Verify that temperature, humidity, pressure, and soil moisture messages appear on the mosquitto_sub terminal.
Flash the Pico W node.
Copy main.py to the Pico W using Thonny or mpremote:
Terminal window
mpremotecpfirmware/pico_node/main.py:main.py
mpremotereset
Verify light and motion messages appear on the broker.
Flash the STM32 node.
Build using STM32CubeIDE or the command-line toolchain and flash via ST-Link:
Terminal window
st-flashwritebuild/stm32_node.bin0x08000000
Verify air quality messages appear on the broker.
Configure Grafana.
Open http://localhost:3000 in your browser. Log in with admin credentials. Add InfluxDB as a data source (Flux query language, URL http://influxdb:8086, token and org as configured). Import or create the dashboard panels listed earlier.
Configure Node-RED alerts.
Open http://localhost:1880. The flow file is pre-loaded. Update the Slack webhook URL in the HTTP request node. Deploy the flow and verify alerts fire when thresholds are exceeded.
Verify end-to-end data flow.
Confirm that sensor data flows from each node through the broker, into InfluxDB via Telegraf, and appears on the Grafana dashboard. Confirm that the same data appears on your SiliconWit.io dashboard via the MQTT bridge.
Run failure tests (see the next section).
Failure Testing
A production system must handle failures gracefully. Run each of these tests and verify the expected behavior.
Test 1: Unplug a Sensor Node
Power off the ESP32 node by disconnecting its USB cable.
Expected behavior:
The MQTT broker delivers the last will message (“offline”) on greenhouse/esp32-node/status within the keep-alive timeout (30 seconds).
Grafana’s device status panel shows the ESP32 node as offline.
After 5 minutes with no data, Node-RED’s inactivity check fires a Slack notification.
The Pico W and STM32 nodes continue publishing normally.
Recovery: Reconnect the ESP32 node. It should reconnect to the broker (using exponential backoff if Wi-Fi or the broker is temporarily unreachable), publish “online” to the status topic, flush any buffered readings, and resume normal 30-second publishes.
Test 2: Restart the Broker
Stop and restart the Mosquitto container:
Broker restart test
dockercomposerestartmosquitto
Expected behavior:
All three sensor nodes detect the TCP connection drop and enter their reconnection loops with exponential backoff.
The broker comes back up within a few seconds.
Nodes reconnect, re-publish their “online” status, and resume publishing sensor data.
Telegraf also reconnects and resumes writing to InfluxDB.
The Grafana dashboard shows a brief gap in data (the duration of the broker restart) but otherwise continues normally.
Any readings that occurred during the downtime are buffered on the ESP32 node and flushed on reconnection.
Test 3: Kill Power to the Broker Host
This simulates a complete infrastructure failure. Shut down the entire Docker host machine.
Expected behavior:
All local services (broker, InfluxDB, Grafana, Node-RED, API) go down.
The SiliconWit.io cloud still has all data up to the moment of failure, because the MQTT bridge was forwarding in real time.
You can log into siliconwit.io from any device and see the last known readings for all sensor nodes.
When the host comes back online, docker compose up -d starts all services. Sensor nodes reconnect, and data flow resumes.
This test demonstrates the value of cloud forwarding: even with a complete local outage, you retain visibility through SiliconWit.io.
Test 4: Network Partition
Disconnect the broker host from the internet (unplug the Ethernet cable or disable Wi-Fi on the host).
Expected behavior:
The MQTT bridge to SiliconWit.io drops, but the local broker continues operating normally.
Sensor nodes are on the same LAN, so they keep publishing to the local broker.
InfluxDB and Grafana continue receiving and displaying data.
When the internet connection is restored, the MQTT bridge reconnects to SiliconWit.io automatically.
Messages published during the outage are not retroactively forwarded (standard MQTT bridge behavior), but new messages resume immediately.
SiliconWit.io as the Cloud Layer
The MQTT bridge in mosquitto.conf forwards every message under greenhouse/# to SiliconWit.io. This is not a backup. It is a live mirror that provides several production benefits:
Remote monitoring. You can check greenhouse conditions from your phone or any browser by logging into siliconwit.io. No VPN, no port forwarding, no dynamic DNS.
Redundant visibility. If your local Grafana instance is unreachable (power outage, network issue, server crash), SiliconWit.io still has the most recent data. You know the last state of every sensor before the outage.
Alert forwarding. SiliconWit.io has its own alert system. You can configure cloud-side alerts as a second layer: if your local Node-RED fails to send a Slack notification (because the host is down), SiliconWit.io can still detect the anomaly and notify you.
Data sharing. If you need to share greenhouse data with a colleague, an agronomist, or a client, you can give them read access on SiliconWit.io without exposing your local network.
Historical comparison. SiliconWit.io retains data according to your plan. You can compare this week’s greenhouse conditions with last month’s, even if your local InfluxDB has already aged out older data.
The bridge configuration is straightforward: topic greenhouse/# out 1 means “forward all messages matching greenhouse/#, outbound only, with QoS 1.” The bridge uses TLS and authenticates with your SiliconWit.io credentials. If the connection drops, Mosquitto reconnects automatically.
Production Hardening
A system that works in the lab is not the same as a system that runs unattended for months. These are the hardening steps for a real deployment.
Log Rotation
Docker containers write logs that can fill a disk if unchecked. Configure log rotation in docker-compose.yml or in the Docker daemon configuration:
Add to each service in docker-compose.yml
logging:
driver: "json-file"
options:
max-size: "10m"
max-file: "3"
For Mosquitto’s own log file (written inside the container), add a logrotate configuration or limit the file size in mosquitto.conf:
mosquitto.conf (add)
log_type warning
log_type error
# Omit "log_type all" in production to reduce log volume
Your monitoring system itself needs monitoring. If InfluxDB crashes or Grafana becomes unresponsive, who alerts you?
Approach 1: External uptime checks. Use an external service (UptimeRobot, Healthchecks.io, or a simple cron job on another machine) that pings your Flask API’s /api/health endpoint every minute. If it fails to respond, you receive an email or SMS.
Approach 2: SiliconWit.io as the watchdog. Since data is forwarded to SiliconWit.io, configure a SiliconWit.io inactivity alert: if no data arrives from the bridge for 10 minutes, something is wrong with your local infrastructure. This uses the cloud layer as a health check for the local stack.
echo"Greenhouse API is down"|mail-s"ALERT: Greenhouse Down"[email protected]
Certificate Renewal
TLS certificates expire. Set a calendar reminder or a cron job to renew them before expiration. When you renew the broker certificate, restart Mosquitto and verify that all clients reconnect successfully.
Check certificate expiration
opensslx509-incerts/server.crt-noout-enddate
# Output: notAfter=Mar 10 00:00:00 2027 GMT
Scaling Considerations
The system as described handles three sensor nodes comfortably. What changes at larger scales?
100 Nodes
At 100 nodes publishing every 30 seconds, the broker handles roughly 200 messages per minute. Mosquitto on a Raspberry Pi 4 can sustain this without difficulty. The main concern is InfluxDB write throughput and storage.
Changes needed:
Increase InfluxDB write-buffer-size in the configuration.
Use Telegraf’s batch_size and flush_interval to batch writes instead of writing every message individually.
Add a wildcard ACL pattern (user device-%c with topic write greenhouse/%c/#) so you do not need 100 individual ACL entries.
Automate device provisioning (Lesson 7) so you are not manually creating credentials for each node.
1,000 Nodes
At 1,000 nodes, the single Mosquitto instance may become a bottleneck. MQTT bridging between multiple brokers or switching to a clustered broker (EMQX, HiveMQ) becomes necessary.
Changes needed:
Deploy EMQX or HiveMQ as a clustered MQTT broker (3 nodes minimum for high availability).
Move InfluxDB to dedicated hardware or use InfluxDB Cloud.
Place Telegraf behind a load balancer or run multiple Telegraf instances, each subscribing to a subset of topics.
Add a message queue (Kafka, NATS) between the broker and InfluxDB for buffering during write spikes.
Implement device fleet management: firmware versioning, staged rollouts, health dashboards per device.
Grafana dashboards need variables and template queries instead of hardcoded device names.
Cost Considerations at Scale
Component
3 Nodes
100 Nodes
1,000 Nodes
Broker
Raspberry Pi (free)
Single VM ($10/mo)
3-node cluster ($90/mo)
InfluxDB
Same Pi
Dedicated VM ($20/mo)
InfluxDB Cloud ($100+/mo)
Grafana
Same Pi
Same VM
Grafana Cloud ($50/mo)
SiliconWit.io
Free tier
Growth plan
Enterprise plan
Total infra
~$0/mo
~$30/mo
~$240+/mo
These are rough estimates. The point is that the architecture you built in this capstone scales without a fundamental redesign. The same MQTT topic hierarchy, the same Telegraf pipeline, the same Grafana queries all work at higher scale with configuration changes rather than a rewrite.
What You Have Built
This capstone ties together every lesson in the IoT Systems course and draws on skills from the embedded programming series.
Skill
Where You Learned It
How You Used It Here
Protocol selection (MQTT vs HTTP vs CoAP)
Lesson 1
Chose MQTT for all sensor-to-broker communication
Broker setup, TLS, ACLs, bridging
Lesson 2
Configured Mosquitto with TLS, per-device ACLs, SiliconWit.io bridge
Multi-MCU MQTT clients
Lesson 3
Wrote firmware for ESP32, Pico W, and STM32 nodes
Time-series storage and dashboards
Lesson 4
Deployed Telegraf, InfluxDB, and Grafana with production queries
REST API and device integration
Lesson 5
Built a Flask API for data access and command dispatch
Alerts and automation
Lesson 6
Configured Node-RED with threshold and inactivity alerts via Slack
Device security and provisioning
Lesson 7
Applied TLS on all connections, per-device credentials, ACLs
ESP32 peripherals (I2C, ADC)
ESP32 Course
Read BME280 and soil moisture sensor
Pico W GPIO and ADC
RPi Pico Course
Read LDR and PIR motion sensor
STM32 UART and AT commands
STM32 Course
Controlled ESP-01 for MQTT connectivity
RTOS task management
RTOS Course
FreeRTOS tasks for sensor reading and MQTT publishing
Containerized deployment
Embedded Linux Course
Docker Compose for the full backend stack
You now have a complete, production-grade IoT monitoring system. It handles node failures, broker restarts, and network outages. It provides local dashboards for real-time visibility and cloud forwarding for remote access. It alerts you when something goes wrong and stores historical data for analysis.
This is not a demo. This is the pattern that real IoT deployments follow, whether the system monitors a greenhouse, a factory floor, a building’s HVAC, or a fleet of agricultural robots. The scale changes, the specific sensors change, but the architecture remains the same: nodes publish, brokers route, databases store, dashboards visualize, alerts notify, and the cloud provides reach.
Exercises
Exercise 1: Add OTA Firmware Updates
Add over-the-air firmware update capability to the ESP32 node. The node should check a firmware HTTP server on each boot (or at a configurable interval) for a newer firmware version. If a new version is available, it should download, verify the SHA-256 hash, and apply the update. Use the ESP-IDF OTA library from the ESP32 course (Lesson 7: OTA Updates and Secure Boot). Test by deploying a firmware update that changes the publish interval from 30 seconds to 15 seconds, and verify the change takes effect after the OTA completes.
Exercise 2: Add an Edge Gateway with Embedded Linux
Deploy a Raspberry Pi running a custom Yocto or Buildroot image (from Embedded Linux Lesson 9) as an edge gateway between the sensor nodes and the cloud. The edge gateway should run a local Mosquitto instance that the sensor nodes publish to over the LAN, perform local data aggregation (compute 5-minute averages), forward aggregated data to SiliconWit.io (reducing cloud bandwidth), cache raw data locally in SQLite for 7 days, and continue operating even when the internet is down. This exercise combines the Embedded Linux course’s custom image building with the IoT Systems course’s broker bridging.
Exercise 3: Multi-Channel Alert Escalation
Extend the alert system with escalation tiers. A warning alert (humidity low, soil dry) should send a Slack message. If the condition persists for 15 minutes without acknowledgment, escalate to an SMS via Twilio. If it persists for 30 minutes, escalate to a phone call. Implement the escalation logic in Node-RED using flow context to track alert state and timers. Add an acknowledgment endpoint to the Flask API so that a user can acknowledge an alert and stop escalation.
Exercise 4: Grafana Provisioning and Infrastructure as Code
Replace the manual Grafana dashboard setup with fully automated provisioning. Create a Grafana provisioning directory with a datasource YAML that configures InfluxDB automatically, and a dashboard JSON that defines all panels programmatically. When docker compose up runs for the first time, Grafana should start with the complete dashboard already configured, no manual steps required. Export your current dashboard as JSON, parameterize it with Grafana variables for the node names, and test by tearing down the stack (docker compose down -v) and bringing it back up.
Comments