When embedded firmware misbehaves, you cannot just add print statements and re-run. The bug might be a stack overflow that corrupts memory silently, a HardFault triggered by a null pointer dereference, or a race condition between an interrupt and the main loop. The only reliable path to these bugs is a proper debugger. In this lesson you will set up GDB with OpenOCD over SWD, learn every debugging technique the Cortex-M3 offers, and then hunt down five real bugs planted in a firmware project. #STM32 #Debugging #GDB
What We Are Building
Bug Hunt Challenge: Find and Fix Five Bugs
A pre-written firmware project with five intentionally planted bugs that cause various failure modes: a HardFault from an unaligned access, a stack overflow from unbounded recursion, a peripheral misconfiguration that silently drops data, a race condition between DMA and main loop code, and a watchdog timeout from a blocking loop. You will use GDB, SWD breakpoints, watchpoints, fault register decoding, and ITM trace to find and fix each one.
Project specifications:
Parameter
Value
Board
Blue Pill (STM32F103C8T6)
Debugger
ST-Link V2 clone via SWD
Debug software
GDB (gdb-multiarch or arm-none-eabi-gdb) + OpenOCD
OpenOCD listens on port 3333 for GDB connections and port 4444 for a telnet command interface.
Connecting GDB
Terminal window
# Terminal 2: Start GDB
arm-none-eabi-gdbfirmware.elf
# Or if using gdb-multiarch (common on Ubuntu)
gdb-multiarchfirmware.elf
Inside GDB:
# Connect to OpenOCD
target remote localhost:3333
# Load firmware into flash
monitor reset halt
load
# Set a breakpoint at main
break main
# Start execution
continue
Essential GDB Commands
Command
Short
Description
break main
b main
Set breakpoint at function
break *0x08001234
b *0x08001234
Breakpoint at address
continue
c
Resume execution
step
s
Step one source line (into functions)
next
n
Step one source line (over functions)
stepi
si
Step one instruction
print var
p var
Print variable value
print/x var
p/x var
Print in hexadecimal
info registers
i r
Show all CPU registers
info breakpoints
i b
List breakpoints
backtrace
bt
Show call stack
watch var
Break when variable changes
x/16xw 0x20000000
Examine 16 words at address
monitor reset halt
Reset and halt the MCU
Breakpoints and Watchpoints
The Cortex-M3 has 6 hardware breakpoints and 4 hardware watchpoints built into the silicon. Hardware breakpoints work on flash memory (where your code lives) without modifying the code. Watchpoints trigger when a memory address is read or written, which is invaluable for finding out who is corrupting a variable. GDB can also set software breakpoints by inserting a special instruction (BKPT), but these only work in RAM.
Using Breakpoints
# Break when entering uart_send_string
break uart_send_string
# Conditional breakpoint: only when adc_value > 3000
break main.c:85 if adc_values[0] > 3000
# Temporary breakpoint (deleted after first hit)
tbreak process_command
# Delete all breakpoints
delete
Using Watchpoints
# Break when 'counter' variable is written
watch counter
# Break when 'counter' is read
rwatch counter
# Break when memory at specific address is written
watch *(uint32_t*)0x20000100
# Useful for finding who corrupts a specific variable
watch stack_canary
Examining Memory
# Examine the stack (16 32-bit words at current SP)
x/16xw $sp
# Examine the vector table
x/16xw 0x08000000
# Examine a peripheral register (e.g., RCC->CR)
x/xw 0x40021000
# Examine a struct
print *((GPIO_TypeDef*)0x40010800)
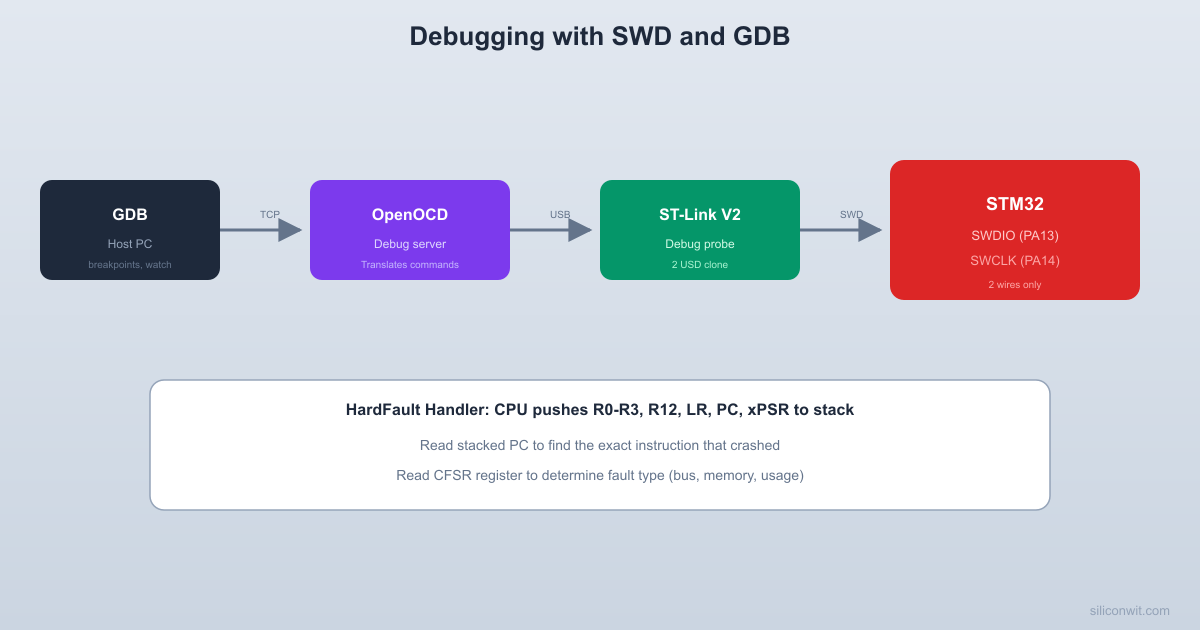
HardFault Decoding
When the Cortex-M3 encounters an error it cannot handle (invalid memory access, undefined instruction, divide by zero with the trap enabled), it triggers a HardFault exception. The CPU saves its state on the stack so a fault handler can inspect what went wrong.
  HardFault stack frame (pushed by HW):
  Higher address (older data)  +----------------+  | xPSR           |  SP + 28  +----------------+  | PC (return)    |  SP + 24  <-- faulting  +----------------+               instruction  | LR             |  SP + 20  +----------------+  | R12            |  SP + 16  +----------------+  | R3             |  SP + 12  +----------------+  | R2             |  SP + 8  +----------------+  | R1             |  SP + 4  +----------------+  | R0             |  SP + 0  +----------------+  Lower address (SP after fault)
  In GDB: print/x stack_frame[6]  gives the PC of the faulting instruction.
The CPU pushes eight registers onto the stack (R0-R3, R12, LR, PC, xPSR) and jumps to the HardFault handler. By examining these saved registers, you can determine exactly which instruction caused the fault and what the processor state was at that moment.
HardFault Handler
voidHardFault_Handler(void) {
__asm volatile (
"TST LR, #4 \n" /* Check which stack was in use */
"ITE EQ \n"
"MRSEQ R0, MSP \n" /* Main stack pointer */
"MRSNE R0, PSP \n" /* Process stack pointer */
"B hard_fault_handler_c \n"
);
}
voidhard_fault_handler_c(uint32_t*stack_frame) {
volatileuint32_t r0 =stack_frame[0];
volatileuint32_t r1 =stack_frame[1];
volatileuint32_t r2 =stack_frame[2];
volatileuint32_t r3 =stack_frame[3];
volatileuint32_t r12 =stack_frame[4];
volatileuint32_t lr =stack_frame[5];
volatileuint32_t pc =stack_frame[6]; /* Faulting instruction */
volatileuint32_t bfar =SCB->BFAR; /* Bus fault address */
/* Suppress unused variable warnings */
(void)r0; (void)r1; (void)r2; (void)r3;
(void)r12; (void)lr; (void)psr;
(void)cfsr; (void)hfsr; (void)mmfar; (void)bfar;
/*
* In GDB, set a breakpoint here and examine:
* print/x pc -> address of faulting instruction
* print/x lr -> return address (caller)
* print/x cfsr -> fault type bits
* info line *pc -> source file and line number
*/
while (1); /* Halt here for debugger */
}
CFSR Bit Decoding
Bit Range
Register
Key Bits
[7:0]
MMFSR (MemManage)
MMARVALID, DACCVIOL, IACCVIOL
[15:8]
BFSR (BusFault)
BFARVALID, PRECISERR, IMPRECISERR
[31:16]
UFSR (UsageFault)
UNDEFINSTR, INVSTATE, INVPC, UNALIGNED
Debugging a HardFault in GDB
# When the firmware hits the HardFault handler:
break hard_fault_handler_c
# After it breaks, examine the saved PC (faulting instruction)
print/x stack_frame[6]
# Look up which source line that address corresponds to
info line *0x08001A3C
# Examine the fault status registers
print/x *(uint32_t*)0xE000ED28 # CFSR
print/x *(uint32_t*)0xE000ED2C # HFSR
# Examine the faulting address (if MemManage or BusFault)
print/x *(uint32_t*)0xE000ED34 # MMFAR
print/x *(uint32_t*)0xE000ED38 # BFAR
ITM Trace Output
ITM (Instrumentation Trace Macrocell) is a hardware debug feature that sends data from the MCU to the debugger through the SWO (Serial Wire Output) pin. It provides printf-style output without consuming a UART.
  ITM trace output path:
  Firmware            Cortex-M3 debug HW  +---------+        +------------------+  | ITM     |  write | ITM stimulus     |  | PORT[0] |------->| port 0           |  | .u8 = c |        +--------+---------+  +---------+                  |                               v                        +------+------+                        | TPIU        |                        | (Trace Port)|                        +------+------+                               |                            SWO pin (PB3)                               |                        +------+------+                        | ST-Link V2  |                        +------+------+                               |                        +------+------+                        | OpenOCD     |                        | /tmp/itm.fifo                        +-------------+
Unlike UART printf debugging, ITM does not consume a UART peripheral and has minimal impact on timing. You can send trace messages, variable values, and timestamps through stimulus ports. The Blue Pill’s SWO pin is PB3 (shared with JTDO).
ITM Printf
/* Send a character via ITM stimulus port 0 */
voiditm_putc(charc) {
while (ITM->PORT[0].u32==0); /* Wait until port is ready */
Comments