

Carbon monoxide, and its peak
The instantaneous value plus the highest reached in each window. A short spike between samples is exactly what you must not miss.
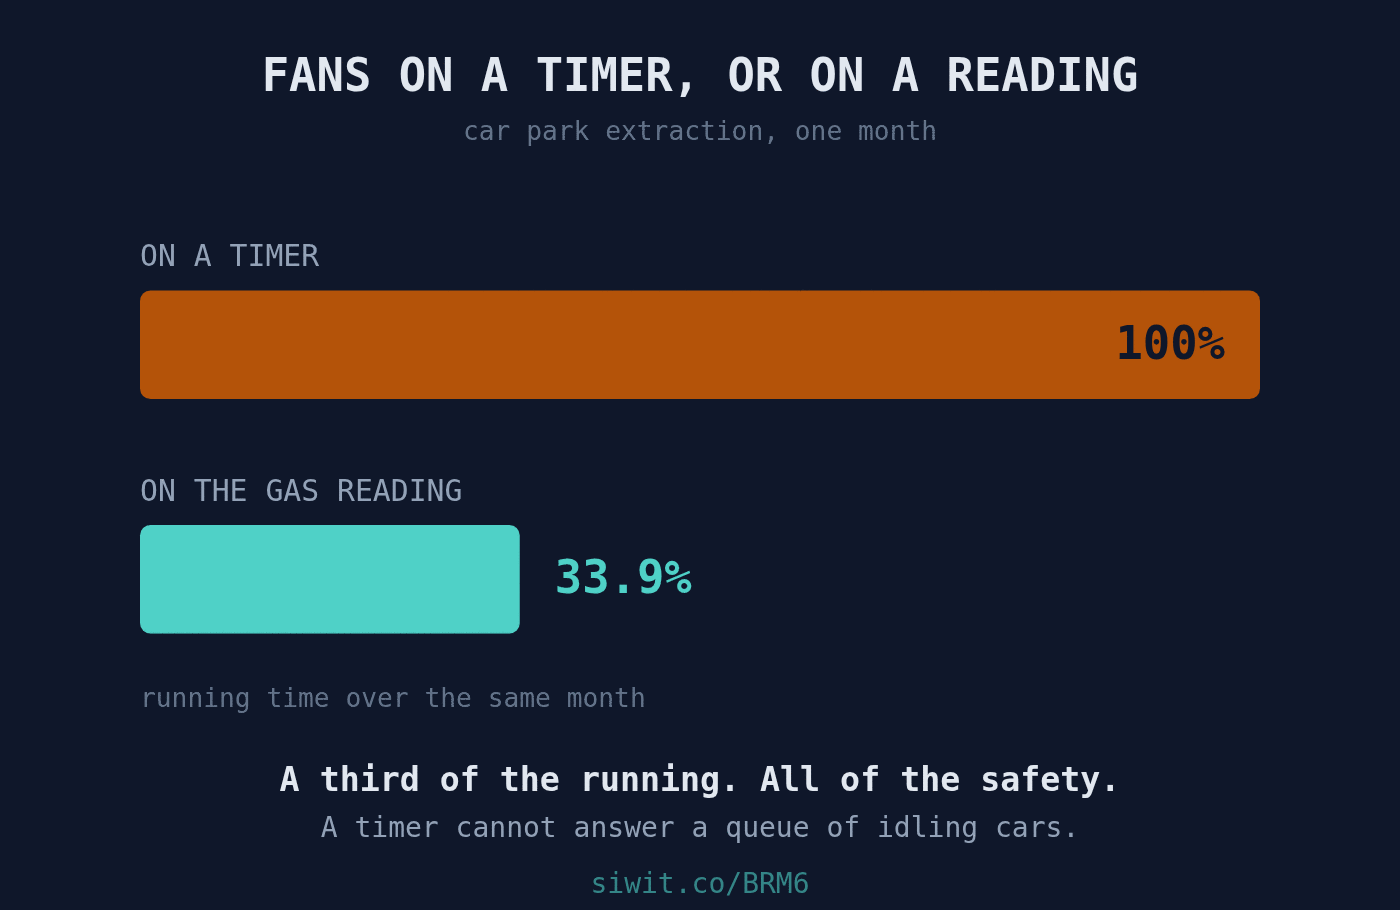
Carbon monoxide is colourless, odourless, and heavier traffic makes more of it. An underground car park is therefore a room where the hazard is invisible, the source is unpredictable, and the control is a large electric fan that somebody has to decide when to run. For most of the history of car parks that decision has been made by a time switch. #EnvironmentSafety #RemoteMonitoring #Ventilation
Carbon monoxide monitoring in an underground car park, with the extraction fans reporting their own running state alongside the gas reading. The owner’s summary of the previous arrangement: the fans used to run on a timer whether anyone needed them or not.
A timer is a guess about occupancy, frozen at the moment somebody set it. It is wrong in both directions. It runs the fans through quiet Sunday mornings, and it holds the same schedule on the evening a queue backs up at the barrier with thirty engines idling.
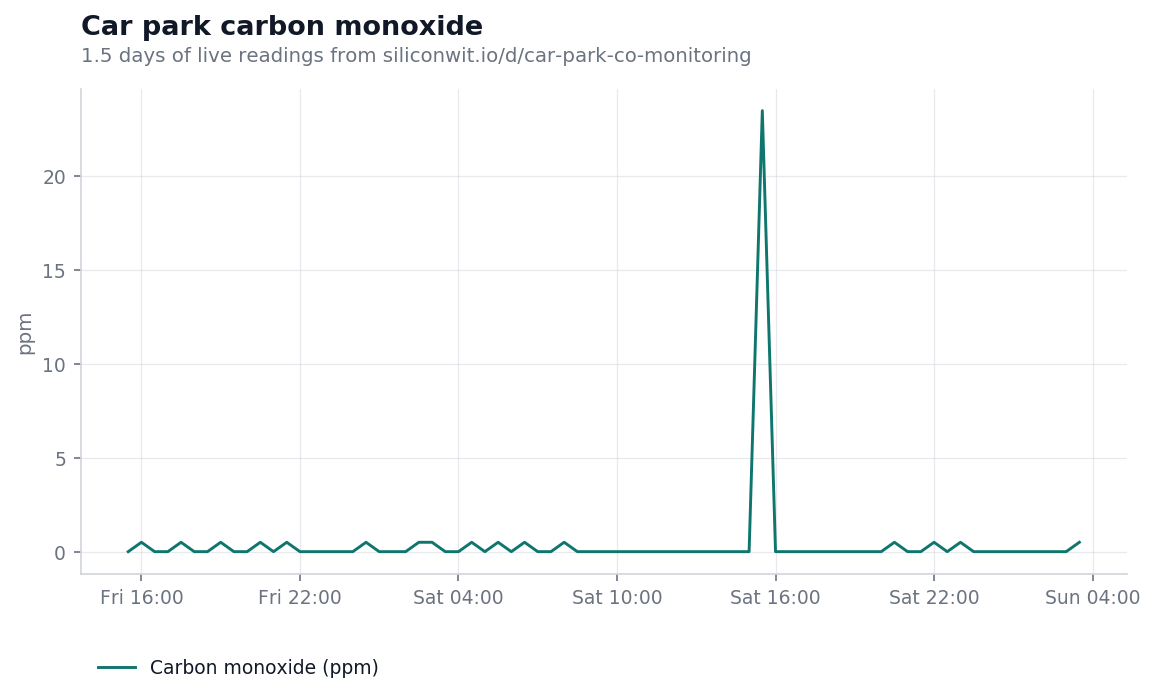
The striking thing about this chart is how empty it is. Carbon monoxide in a well ventilated car park reads at or near zero almost all of the time, and over a normal three day window this one averaged 0.17 ppm and never exceeded 1.5.
That flatness is the reading doing its job, and it is also the trap. A sensor that reports nothing for weeks is indistinguishable from a sensor that has died, which is why this device also reports detector health, sitting between 97% and 99%. Without that second reading, a flat line is ambiguous. With it, a flat line means the air is clean and the instrument is awake.
Then there is the exception. On Saturday 18 July at 15:30, carbon monoxide reached 75 ppm. On a chart scaled to a normal week, that is not a bump. It is a wall.
For context on why 75 matters, occupational exposure limits are commonly set around 30 to 35 ppm as an eight hour average, with short term limits well above that. A brief 75 ppm reading is not a fatality, and treating it as one would be alarmist. It is, however, several hundred times the room’s own baseline, and it is exactly the condition the fans exist for.
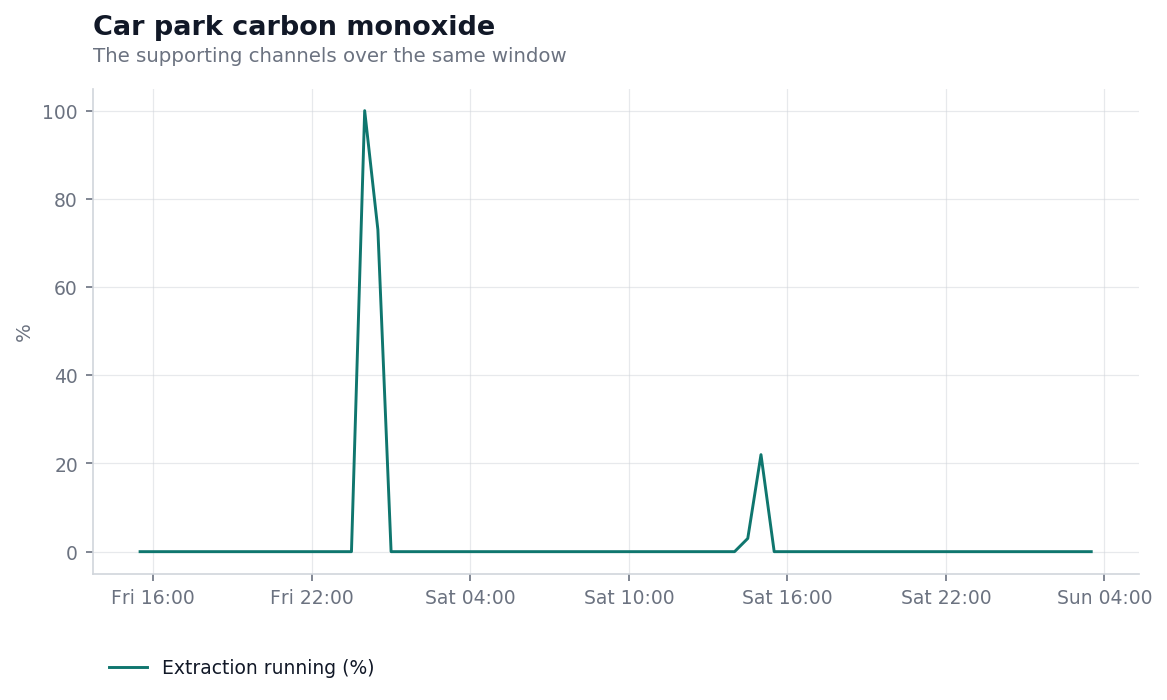
Same window, the fans’ own account of themselves.
This is the reading that separates a monitoring system from a control system. The gas chart tells you the air got bad. This chart tells you something was done about it, when, and for how long, without anybody being asked.
Over the full month the extraction ran 33.9% of the time. Set that against a timer running fans on a fixed daily schedule and the saving is the difference between those two numbers, on plant that is typically several kilowatts and sometimes very much more.
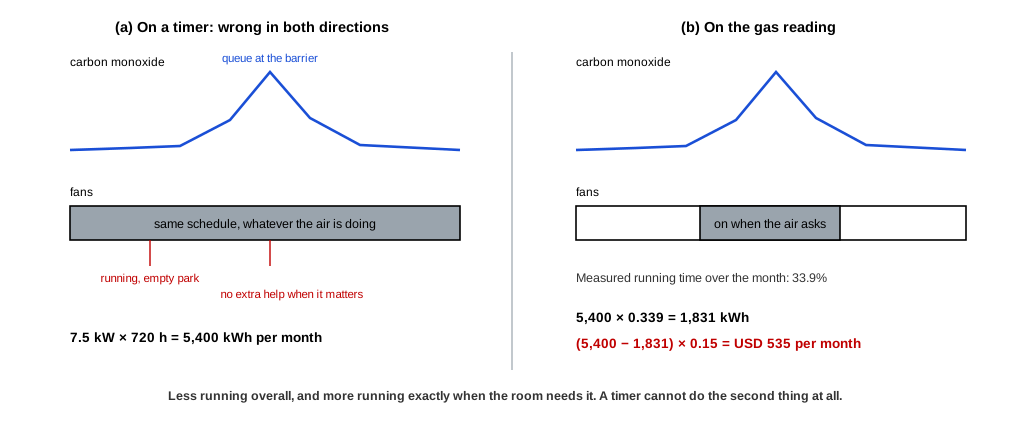
The safety argument and the energy argument point the same way here, which is rarer than it sounds. Demand controlled ventilation runs the fans less overall and runs them harder exactly when the room needs it. A timer cannot do the second thing at all.
The numbers below are a worked example, not a promise. Put your own figures in.
Take a modest extraction plant drawing 7.5 kW. Running continuously for a 30 day month:
Running instead at the measured 33.9%:
At a conservative USD 0.15 per kWh the difference is
on one car park, and the equipment to achieve it is a gas sensor and a rule.
Against that:
The honest framing is that the safety case justifies the installation and the energy case pays for it. Either one alone would be a harder argument.
Carbon monoxide, and its peak
The instantaneous value plus the highest reached in each window. A short spike between samples is exactly what you must not miss.
Extraction running state
Turns monitoring into proof of response. Without it you know the air went bad and nothing about what happened next.
Detector health
The reading that makes a flat line trustworthy. A silent sensor and a clean room look identical without it.
Fan runtime hours
Where the energy saving is proved, and where you notice a fan that has started running far more than it used to.
The other environment and safety installations share this instrument set and change the gas. A commercial kitchen LPG monitor reads zero nearly always, which its owner is quite content with. Fuel depot vapour monitoring puts extraction status next to the hydrocarbon reading for the same reason this car park does, so it is possible to tell which of the two is the problem. Roadside air quality measures the outdoor version of the same traffic, and found mornings worse than expected because still air holds everything in until the sun gets up.
The demand controlled argument generalises. An office HVAC air handler is monitored partly to settle arguments about whether it is actually running, which is the same question this car park answers with its extraction reading.
The device page shows the live readings, the charts above in their interactive form, and the alert history including the 75 ppm event. If the device link below ever stops resolving, the public device gallery lists everything currently shared, and devices come and go from it as owners decide.
To put your own car park on a chart, you can send readings without creating an account and see them arrive on a live chart in a couple of minutes, or read how to connect a first device.
Open this device Monitor your own equipment
Comments