

Carbon dioxide between the grains
The outcome measurement. Compare it against its own quiet baseline, not against a fixed limit.
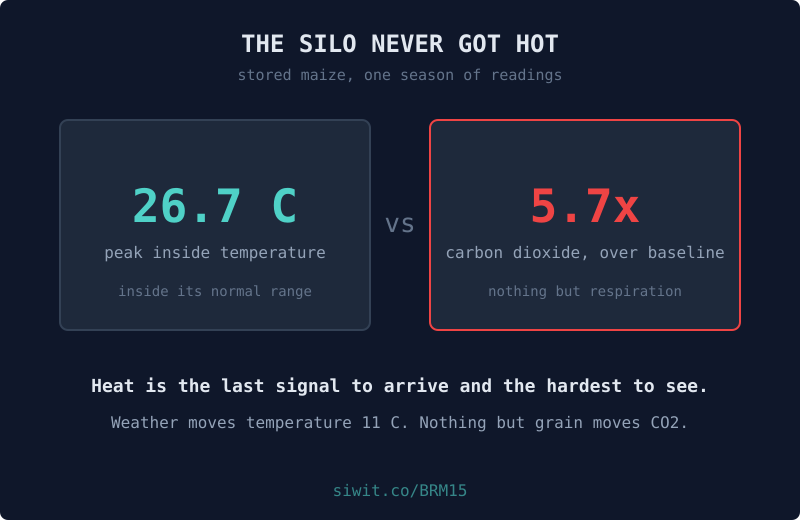
Grain in a silo is alive. It respires slowly, and so does anything growing in it, and respiration has a signature: it consumes oxygen, releases carbon dioxide, and gives off a little heat. Storage practice has traditionally hunted the heat, because a thermometer on a cable is cheap and obvious. The heat is the weakest of the three signals and the last to arrive. #Agriculture #RemoteMonitoring #PostHarvest
A silo holding stored maize, reading temperature and humidity inside the heap, vent position, the carbon dioxide concentration in the space between the grains, and the weather outside.
The owner’s concern is specific and correct: warm damp pockets are where spoilage starts, and you cannot see them from outside the silo.
Every figure in this post is measured over one fixed window, 28 May to 7 August 2026, which is the window the charts show. Naming it matters: these devices keep running, so a claim about “the last ten weeks” stops being true the week after it is written, while a claim about a named window stays checkable against the chart above it forever.
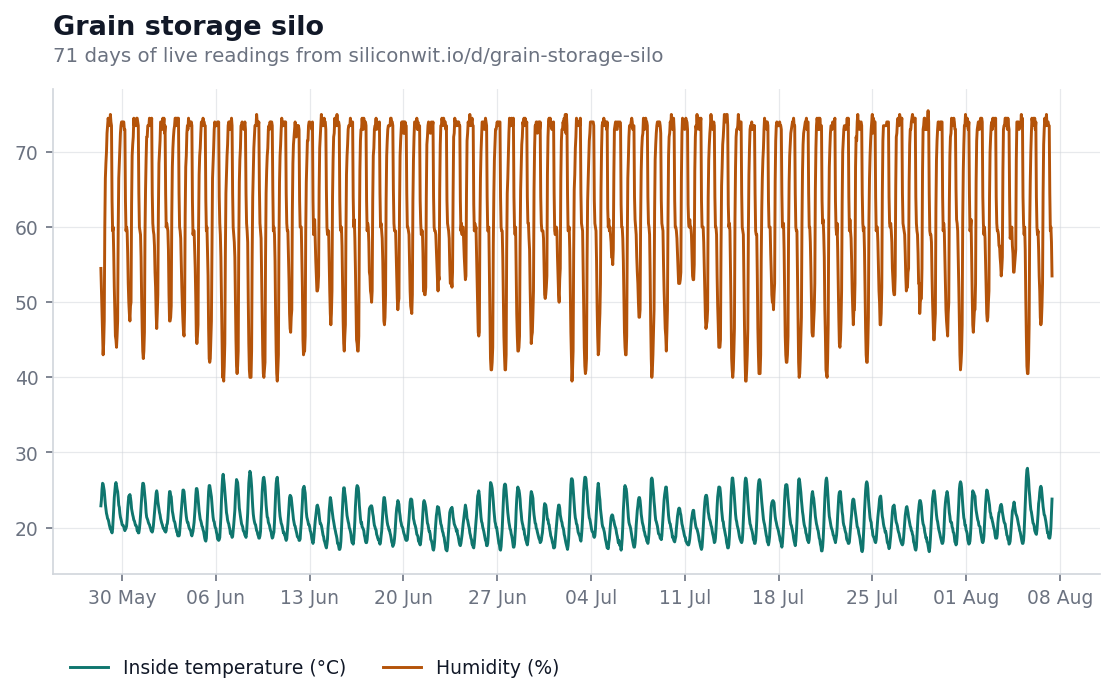
Inside temperature and humidity, across the season. Both move constantly. Temperature ranged from 16.8 °C to 27.9 °C across the whole window, and it visits most of that range in any warm week.
That movement is the problem, not the signal. A silo is a large insulated mass sitting in the weather, so its temperature is dominated by what the weather is doing. To read spoilage from this chart you would have to notice a fraction of a degree of biological heat inside a swing of eleven degrees driven by the sun. Nobody can, and no threshold can either: set one low enough to catch respiration and it fires on every warm afternoon.
Humidity is more informative, because moisture is what starts the process. It is still an input rather than an outcome. It tells you that conditions are permissive. It does not tell you whether anything has actually begun.
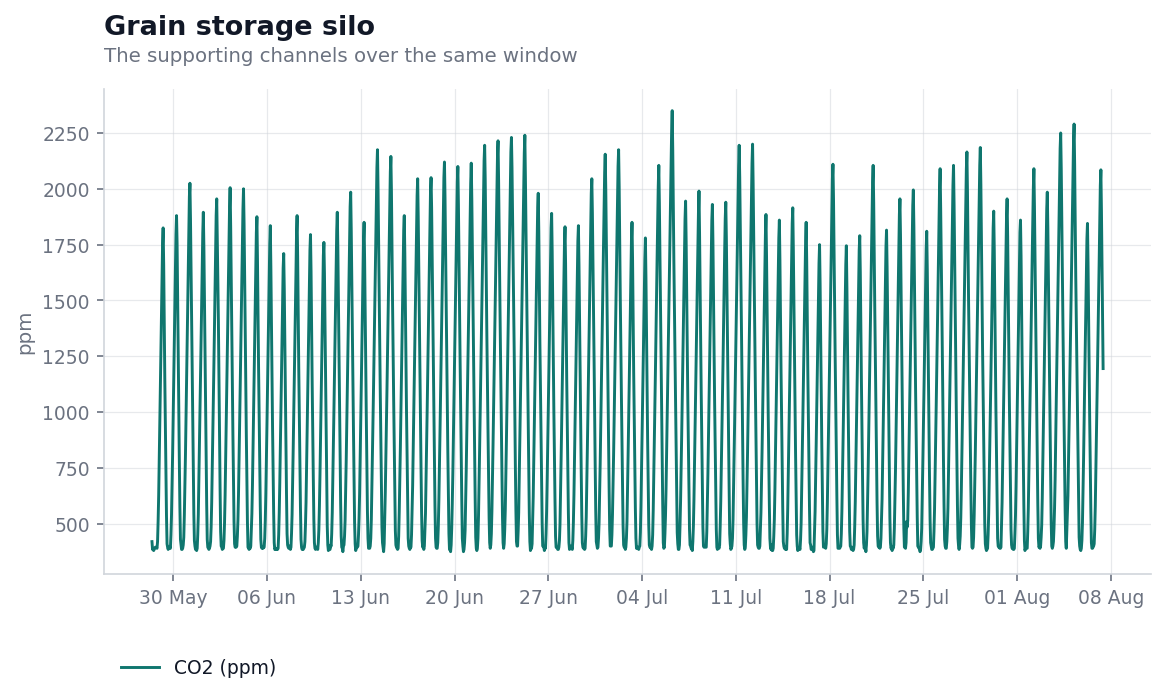
Same silo, same season, the air between the grains.
Baseline sits at about 410 ppm, which is roughly outdoor air, and that is exactly what quiet grain should read. Then there are episodes. The largest reached 2,350 ppm:
and across the window the reading spent
Take the five days around that peak and put the three channels side by side:
The temperature excursion looks dramatic until you notice that 26.7 °C is below the 27.9 °C this silo reached anyway during ordinary warm weather. Nothing about the temperature reading is out of character. The CO2 reading is six times its own baseline, and there is no weather that does that to a carbon dioxide concentration.
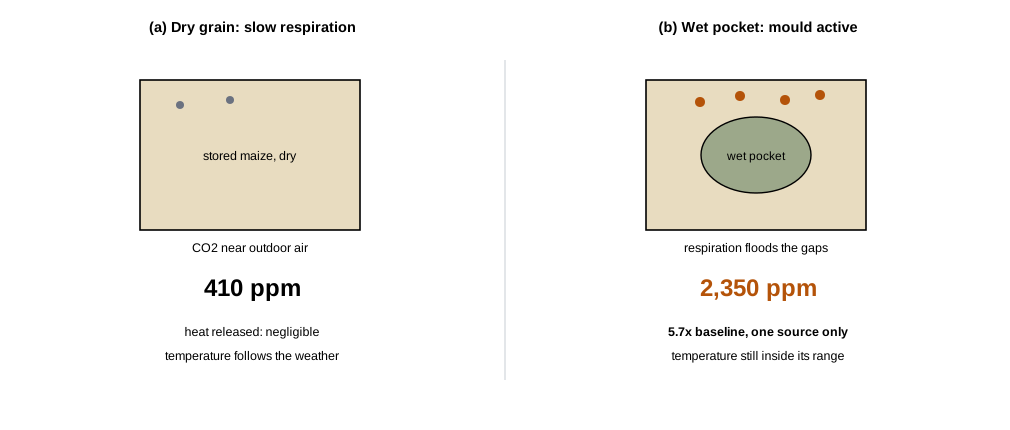
Respiration produces CO2 and heat together, but the two signals face very different competition:
So the same event produces a CO2 change of several hundred percent and a temperature change of a fraction of a degree buried in eleven degrees of weather. This is why published work on stored grain finds CO2 gives a faster and more sensitive indication of spoilage and mycotoxin risk than temperature and relative humidity, and why a wet pocket introduced deliberately raises CO2 sharply while temperature stays comparatively stable.
The consequence is not only spoiled grain. The moulds that thrive in damp maize include the ones that produce aflatoxin, which is a food safety and human health problem rather than a yield problem, and which travels with the crop into whatever it becomes.
The numbers below are a worked example, not a promise. Put your own figures in.
The economics of stored grain are unusual because the loss is not gradual. A consignment is sound, or it is rejected. The value at risk is the whole heap, not a percentage of it, and the intervention when you catch it early is ordinary: run the aeration fans, turn the grain, move the affected section.
Carbon dioxide between the grains
The outcome measurement. Compare it against its own quiet baseline, not against a fixed limit.
Humidity in the heap
The input. It tells you conditions have become permissive, which is your warning to watch the CO2 closely.
Temperature at several depths
Still worth having, but read the differences between probes rather than the absolute value, since the absolute value is mostly weather.
Aeration fan state
Without it you cannot tell a reading that fell because the problem resolved from one that fell because a fan was running.
The other growing installations share this instrument set and ask different questions of it. A greenhouse of cut flowers uses the same channels to hold a climate rather than to detect decay, and its post covers why an alarm that fires every night has stopped being an alarm. A broiler house watches the same air for a reason that is measured in hours, because a ventilation failure costs the flock. A drip irrigation block moves the question underground to soil moisture.
The habit this post is really about is choosing the channel with the best signal-to-noise ratio rather than the most obvious one. That is a measurement design decision, and the statistics done wrong lesson covers why a small effect inside a large source of variation is so hard to detect, however carefully you watch it.
The device page shows the live readings, the charts above in their interactive form, and the alert history. If the device link below ever stops resolving, the public device gallery lists everything currently shared, and devices come and go from it as owners decide.
To put your own silo on a chart, you can send readings without creating an account and see them arrive on a live chart in a couple of minutes, or read how to connect a first device.
Open this device Monitor your own equipment
Comments