



Minimum night flow
The lowest flow between about 02:00 and 04:00, one value per day. Track the value week over week, not against a limit.
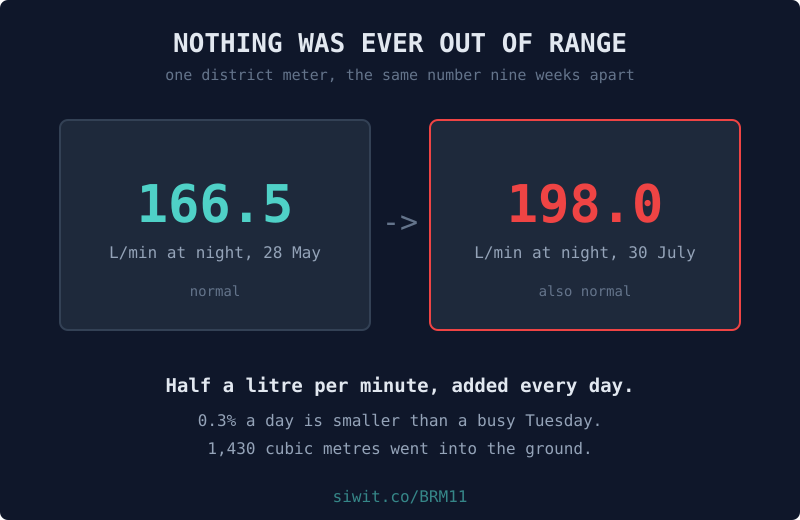
Most monitoring is built to catch the moment something goes wrong. A threshold, an alarm, a message. That works when the fault has a moment. This one did not. It arrived at half a litre per minute per day, which is roughly three tenths of one percent, and three tenths of one percent is smaller than the difference between a Tuesday and a Wednesday. There was never a day when the meter looked wrong. There was only a season when it had become wrong. #Water #RemoteMonitoring #LeakDetection
A district meter on a distribution zone, reading flow continuously, with the network pressure alongside it. The owner is not watching it for consumption. They are watching it because, in their words, whatever is still moving at three in the morning is leaking.
That is the discipline this post is about. Not the alarm, the baseline.
Every figure in this post is measured over one fixed window, 28 May to 7 August 2026, which is the window the charts show. Naming it matters: these devices keep running, so a claim about “the last ten weeks” stops being true the week after it is written, while a claim about a named window stays checkable against the chart above it forever.
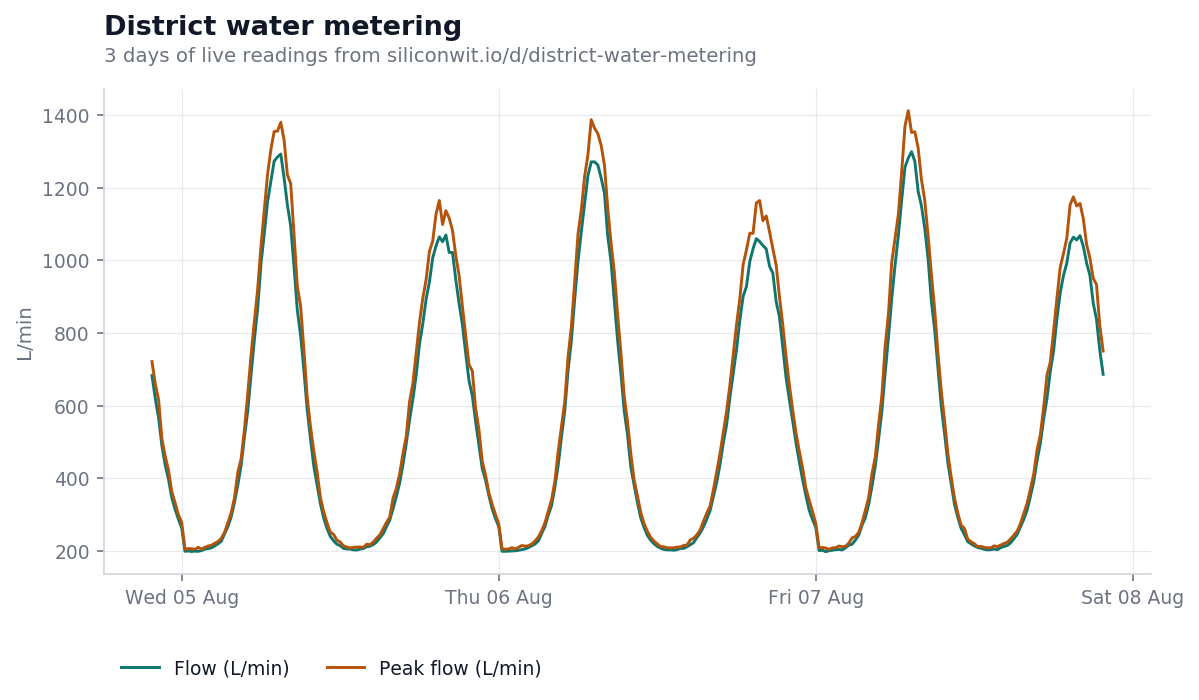
Here are three days. Demand climbs through the morning, peaks, falls back overnight, and does it again. This is what a healthy district looks like, and it is also what this district looked like on every single day of the nine weeks the leak was growing.
That is the whole difficulty. You cannot see a trend in a window shorter than the trend. Three days of a fault that takes nine weeks to become obvious looks exactly like three days of no fault at all.
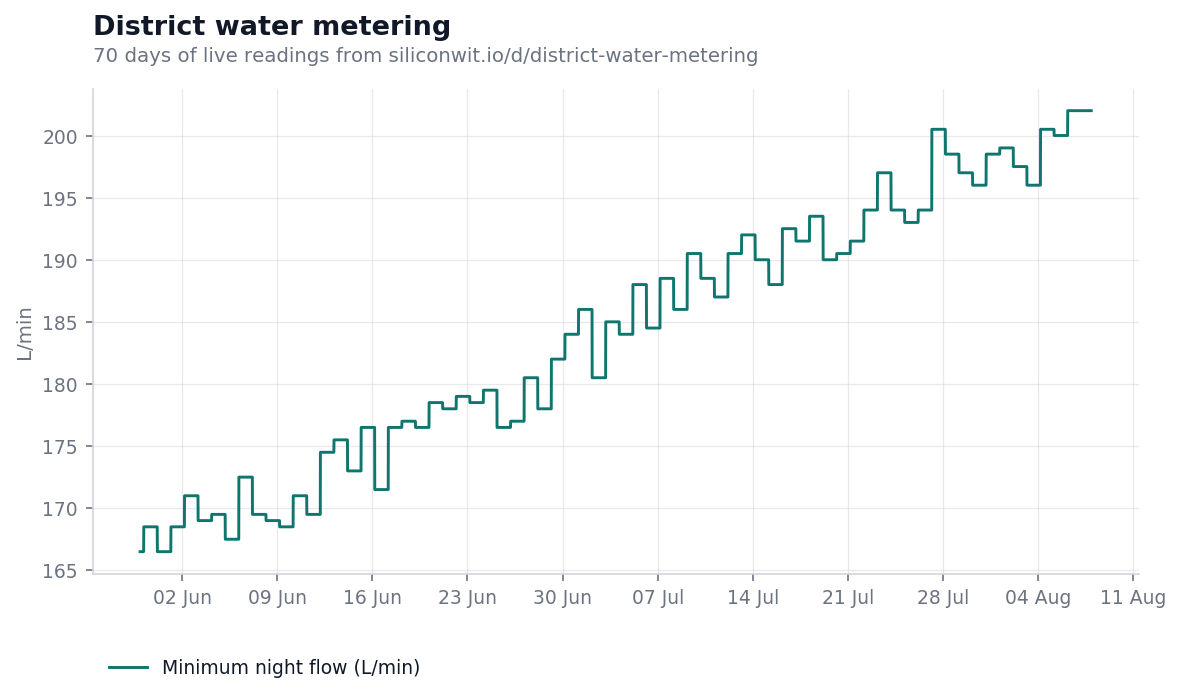
Same meter, same readings, one number per day instead of every reading: the lowest flow the meter saw overnight.
It climbs, for seventy days, without a pause: from 166.4 L/min on 29 May to 202.0 L/min on 7 August. There is no repair on this chart. The highest reading is the last one, which means whatever is leaking is still leaking as this is written.
The rate works out at
Half a litre per minute, per day, against a baseline of 166. That is
Nothing detects three tenths of a percent per day as an event, because it is not an event. Put a threshold anywhere you like on this chart and it fires deep into the second month, long after the water is gone, and only if somebody happened to set it in the right place beforehand.
This is the question that decides whether you send anybody out, and the meter can answer it on its own. Total flow rose too, from 512.4 L/min to 547.1 L/min, which is
A 6.8% rise in consumption is perfectly ordinary. New tenants, a dry spell, a school back in session. If that is all you have, you shrug.
The discriminator is when the extra water moved.
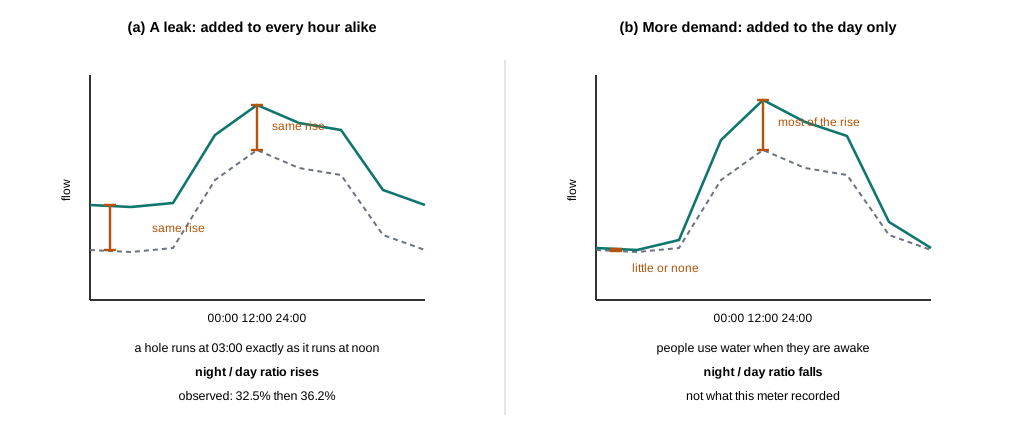
A hole in a pipe does not keep office hours. It runs at 03:00 exactly as it runs at noon, so it adds a constant to every hour, and the overnight trough rises by the same absolute amount as the midday peak. Extra consumption behaves the opposite way: people use water while they are awake, so daytime grows and the overnight trough barely moves.
Those two leave different fingerprints on one ratio. Night flow as a share of day flow went
It rose. Put the two growth rates side by side and the case is plain: daytime total grew 6.8% while the overnight trough grew
The night is growing more than three times faster than the day. Adding a constant to every hour lifts a small number proportionally more than a large one, which is precisely what a round-the-clock loss does and precisely what daytime demand growth cannot do. The extra water is moving at three in the morning. It is a leak, and the meter says so without anyone leaving the office.
The numbers below are a worked example, not a promise. Put your own tariff in.
Today the loss is 35.6 L/min, running continuously:
It did not start at 35.6. It ramped roughly linearly, so the average over the seventy days was about half of today’s figure:
Eighteen hundred cubic metres, lost before anybody noticed, on an installation that was already metered. The meter was there the whole time. Nobody was reading the trend.
Put your own cost per cubic metre against that figure, and then against the alternative. Caught at the end of week two, the leak was running at 7.1 L/min and had cost
which is four percent of what it has cost so far, and it is still running. The detection is the same detection. Only the week is different.
A slow ramp defeats the entire alarm-and-threshold model of monitoring, and it does it in every industry. Bearing wear, panel soiling, filter loading, refrigerant loss, insulation degradation: all of them arrive as a percent per day rather than as a moment, and all of them are invisible to a rule that asks whether today’s reading is acceptable.
The fix is not a better threshold. It is a different question. Instead of asking is this reading in range, ask is this number the same as it was last month, and put the answer where somebody sees it weekly. The comparison costs nothing. The meter is already installed.
Minimum night flow
The lowest flow between about 02:00 and 04:00, one value per day. Track the value week over week, not against a limit.
Night as a share of day
The ratio that separates a leak from a busier month. A leak holds it or lifts it; extra consumption pulls it down.
Network pressure
Leakage rises with pressure. Pressure falling while flow rises points at a burst rather than a creeping loss.
Total volume
The number that gets billed, and the one that reconciles against what was bought. It is the slowest to reveal a problem.
The same network is also metered zone by zone, which asks a different question of the same reading: not whether the loss is growing but where it is and what kind it is. Three zones, residential, older mains and commercial, are compared in two zones, same loss, opposite cause, where one zone loses 42% of its water while its night flow looks perfectly healthy.
The other water installations aim the same instrument set at different questions. Building water storage watches rooftop tanks for a block, where demand that stops matching occupancy is the same argument at a smaller scale. Tenant water monitoring adds who used what, and whether the pump is short cycling. A borehole and storage tank is the case where tank level is the reading everyone installs first and motor current is the one that catches the fault, which is its own post. A quarry dewatering pump is watched properly rather than checked on, because when it stops the work stops.
The habit underneath this post is refusing to read a trend from a window shorter than the trend, which is one of the ways a perfectly honest chart misleads. The lying with charts and data lesson covers the general case, and the leak against demand test is a mechanism argument of the kind the correlation, causation and evidence lesson sets out.
The device page shows the live readings, the charts above in their interactive form, and the alert history. If the device link below ever stops resolving, the public device gallery lists everything currently shared, and devices come and go from it as owners decide.
To put your own meter on a chart, you can send readings without creating an account and see them arrive on a live chart in a couple of minutes, or read how to connect a first device.
Open this device Monitor your own equipment
Comments