

Broadband velocity, trended
Compare it against its own history week over week. The slope is the product; the instantaneous value is just today’s sample.
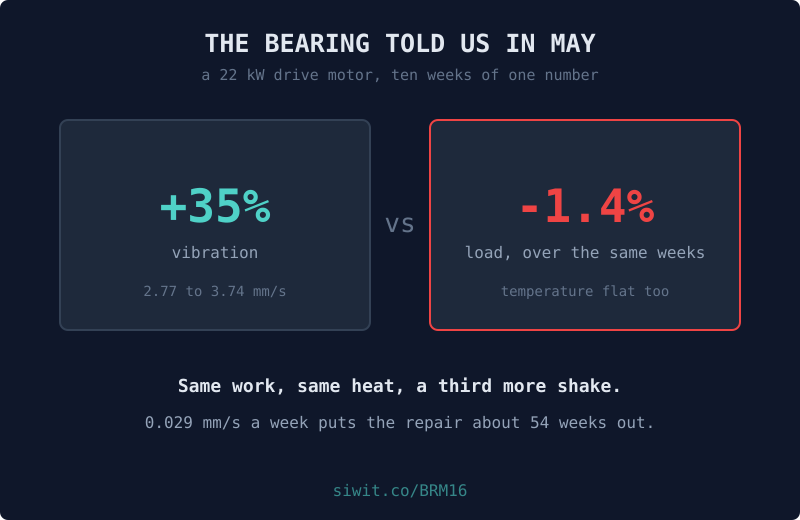
A bearing does not fail on the day it fails. It spends months telling anyone who is listening, in a language of small increases that no single reading is large enough to justify acting on. The whole discipline of condition monitoring rests on one idea: the useful number is not what the machine is doing, it is what the machine is doing differently from last month. #Manufacturing #RemoteMonitoring #PredictiveMaintenance
A 22 kW drive motor on line two, reading load, motor current, bearing temperature, and broadband vibration velocity with the peak inside each reporting window recorded alongside the average.
The owner is direct about why it is instrumented: the vibration trend is the entire reason it is monitored.
Every figure in this post is measured over one fixed window, 28 May to 7 August 2026, which is the window the charts show. Naming it matters: these devices keep running, so a claim about “the last ten weeks” stops being true the week after it is written, while a claim about a named window stays checkable against the chart above it forever.
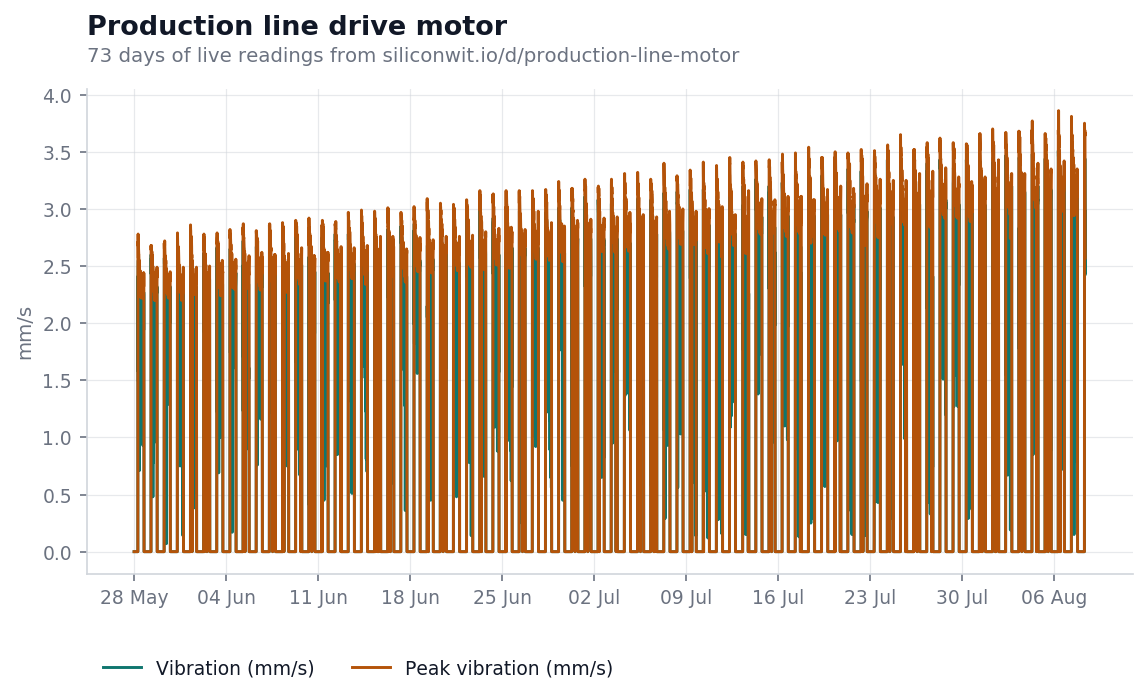
Two vibration channels over seventy one days. Both climb, and neither of them jumps.
Comparing the week beginning 28 May with the week beginning 30 July, sixty three days apart:
Those are named weeks rather than a rolling window, so they stay checkable against the chart above however the machine behaves afterwards. Look at any single day and there is nothing to report. The day-to-day change is
which is four thousandths of a millimetre per second, comfortably inside the noise of the reading. Nobody notices that, and no alarm fires on it, because there is nothing to fire on. Aggregate it into weeks and the same number becomes
and nine of those weeks are close to a third of the machine’s baseline.
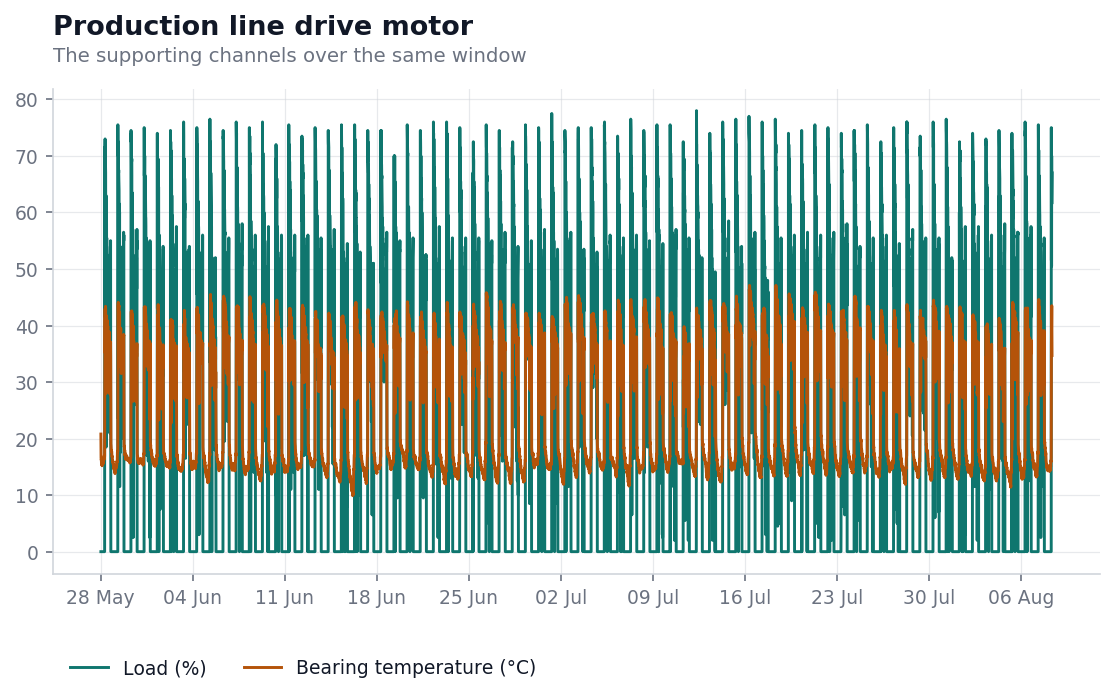
A rising vibration reading has three ordinary explanations before it has an interesting one. The machine is working harder. The machine is running hotter. The sensor has moved. The first two are on this chart, and they are flat.
The motor is doing slightly less work than it was doing in May, at the same temperature, and shaking a third more while doing it. Load moving the wrong way only strengthens the case. That is the reasoning that turns a trend into a diagnosis, and it costs nothing beyond channels the installation already reports. Vibration alone says something changed. Vibration against a flat load says what changed is the machine.
Bearing temperature deserves a note of its own, because it is the reading many people install expecting it to be the warning. It is not. Heat arrives late, when the damage is advanced enough to dissipate real energy, and on this machine it has not moved at all while vibration has risen by a third.
Broadband velocity has published severity bands. A 22 kW motor falls in Class II of ISO 10816-3, machines rated between 15 and 75 kW, and on a rigid foundation the zone boundaries are 1.12, 2.8 and 7.1 mm/s RMS. The standard was superseded by ISO 20816-3 in 2022, which carries the same limits, so a reading judged against either gives the same verdict.
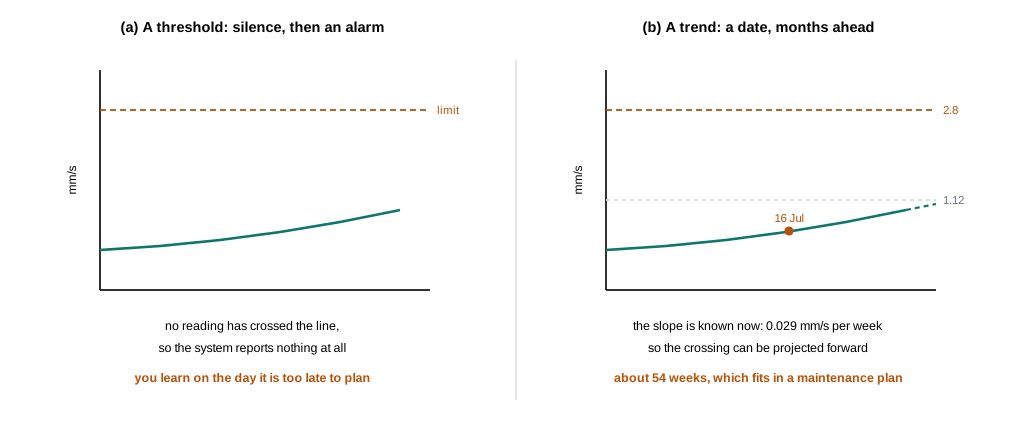
Against those bands, this motor started the window in zone A, which the standard describes as the condition of newly commissioned machinery. Its seven day rolling average reached 1.12 mm/s on 16 July, which puts it in zone B, acceptable for unrestricted long-term operation. It spent 49 of the 72 days in zone A and the remainder in zone B.
Nothing needs doing today. That is the point. The value of knowing is what comes next:
At the rate it held for nine weeks, this bearing reaches the zone B to C boundary, where the standard says investigate and plan corrective action, in roughly a year. That is not a prediction of failure. It is a date you can put in a plan, revise as more readings arrive, and use to decide whether the bearing gets changed during a scheduled shutdown or during an unscheduled one.
That is where this post stood when it was written. On 8 August the bearing was changed, and the reading recorded the repair as clearly as it recorded the fault:
The machine came back below the 0.93 mm/s it was running at in May, which is what a new bearing in a sound housing should read. Nothing else changed: the same load, the same shift, the same sensor in the same place.
That last chart is worth more than the trend that preceded it. A rising line is a hypothesis, and plenty of things make a reading drift. A line that falls by two thirds the day a specific part is replaced is the hypothesis being confirmed, and it is the difference between a monitoring system somebody believes and one they quietly stop reading.
The numbers below are a worked example, not a promise. Put your own figures in.
The saving in condition monitoring is almost never the price of the part. A bearing for a 22 kW motor is an ordinary purchase. The difference between the two ways of buying it is everything else:
Lost production is usually the dominant term and it is the one that scales with how badly the timing lands. A trend converts an unplanned event into a planned one, which is the entire economic argument, and it does it with a sensor and the discipline of looking at last month’s number.
Two practical warnings. A trend is only comparable against itself if the measurement is repeatable, so the sensor must stay in the same place, in the same orientation, measured over the same frequency band. And a vibration reading that suddenly falls is not good news: it usually means the sensor has come loose, which is the same trap as a detector that reads zero.
Broadband velocity, trended
Compare it against its own history week over week. The slope is the product; the instantaneous value is just today’s sample.
Load alongside it
Without it you cannot separate a worsening bearing from a busier line, and that is the first question anybody will ask.
Window peak as well as average
The peak inside each window catches intermittent contact that an average over ten minutes smooths away entirely.
Bearing temperature
Worth having, but expect it to confirm rather than to warn. On this machine it has not moved while vibration rose by a third.
The same instrument set runs on the rest of the rotating plant. An injection moulding machine carries the richest wear record in the fleet, a plant air compressor is watched for waste rather than wear in the post on off-shift load, and a steam boiler feed pump is monitored because it threw a bearing once and took the boiler down with it. A CNC machine tool turns the same channels to utilisation economics in never off, still a shift short.
For the same slow-ramp problem in a completely different medium, a district water meter has added half a litre per minute per day for ten weeks without ever producing an abnormal reading, in nothing was ever out of range. Where a reading needs a second zone before it means anything at all, two zones, same loss, opposite cause makes the comparison explicit.
Choosing to act on a trend before anything has crossed a line is a decision made under uncertainty, with a cost for acting too early and a larger one for acting too late. The making better decisions lesson sets out how to think about that trade rather than defaulting to waiting.
The device page shows the live readings, the charts above in their interactive form, and the alert history. If the device link below ever stops resolving, the public device gallery lists everything currently shared, and devices come and go from it as owners decide.
To put your own motor on a chart, you can send readings without creating an account and see them arrive on a live chart in a couple of minutes, or read how to connect a first device.
Open this device Monitor your own equipment
Comments