

Load during closed hours
The single most valuable number on the machine. Everything it produces while the plant is shut is escaping.
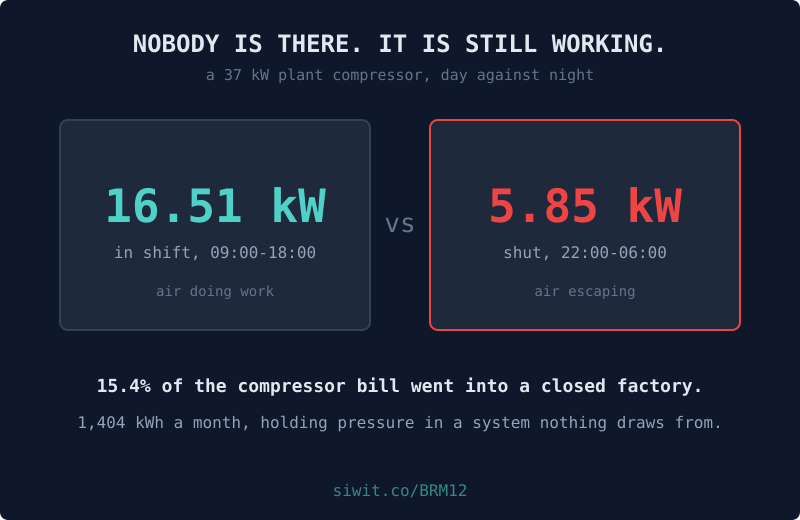
Compressed air feels free at the point of use. You open a valve and air comes out. Nothing meters it, nobody is billed for it, and a hiss in a fitting is the most ignorable fault in any factory, because it costs nothing to leave and nothing visibly happens when you do. The bill arrives somewhere else entirely, on a line called electricity, attached to a machine in a different room. #Manufacturing #RemoteMonitoring #EnergyEfficiency
A 37 kW plant air compressor, working a shift that starts around half past six and ends around eight in the evening. Load, duty, discharge temperature, run time and a cumulative energy counter.
The owner’s reason for instrumenting it is blunt: compressed air costs them more than lighting and heating together, and this is where they prove it to people.
Every figure in this post is measured over one fixed window, 28 May to 7 August 2026, which is the window the charts show. Naming it matters: these devices keep running, so a claim about “the last ten weeks” stops being true the week after it is written, while a claim about a named window stays checkable against the chart above it forever.
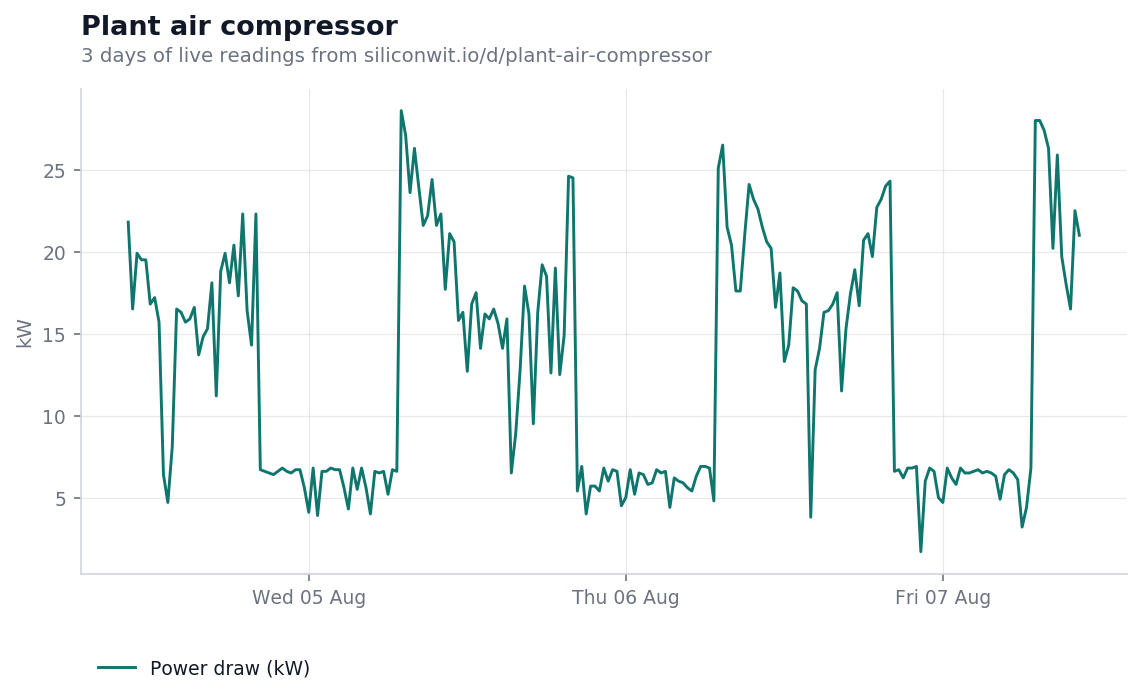
Three days of load. The shape is exactly what you would expect: the compressor works through the day, and drops back at night.
It does not drop to zero.
Averaged across the reporting windows between 22:00 and 06:00, when the plant is shut:
For comparison, the same compressor between 09:00 and 18:00, with the plant running and drawing air:
Nothing is switched on at night. No tool is running, no cylinder is actuating, no line is being blown down. The compressor is holding pressure in a sealed system, and a sealed system that needs 5.85 kW to stay sealed is not sealed.
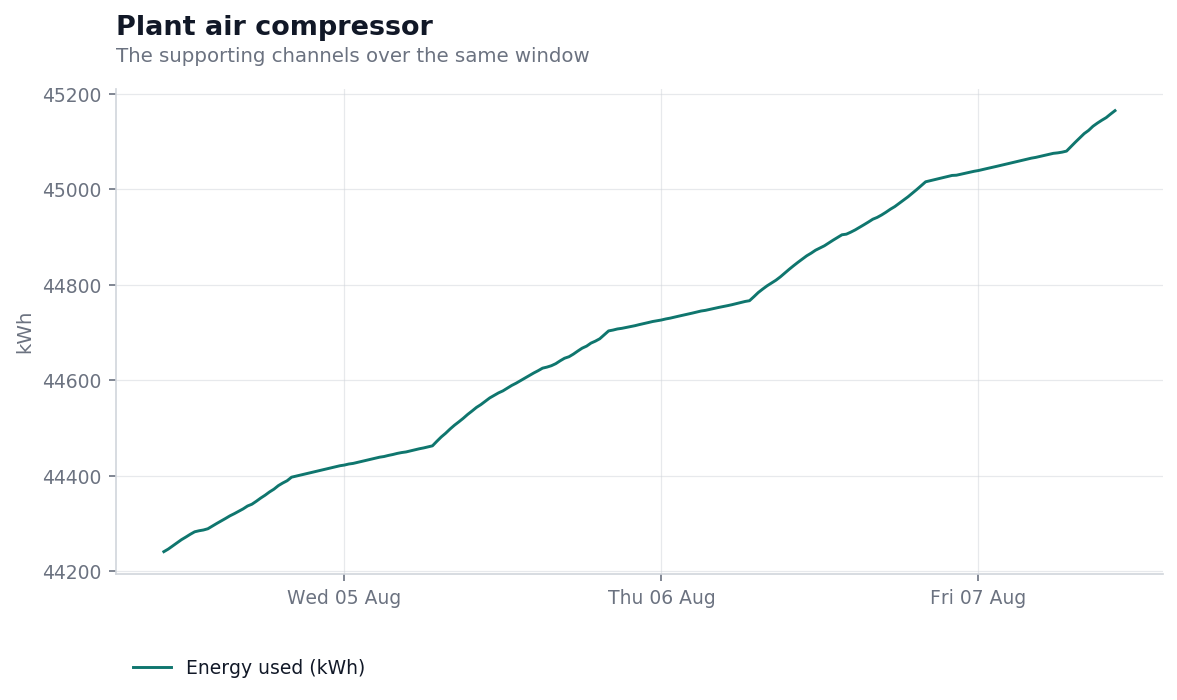
This is the energy counter over the same window. It climbs steeply during the shift, as it should. The part worth looking at is what it does between the shifts: it keeps climbing. It never goes flat.
Over the thirty days of readings the counter moved
and the overnight portion of that, at eight closed hours a day, is
which as a share of everything the compressor consumed is
Roughly one kilowatt hour in every six and a half went into a factory that was closed. That figure excludes weekends and any part of the working day when the plant is idle but the compressor is not, so it is the conservative version.
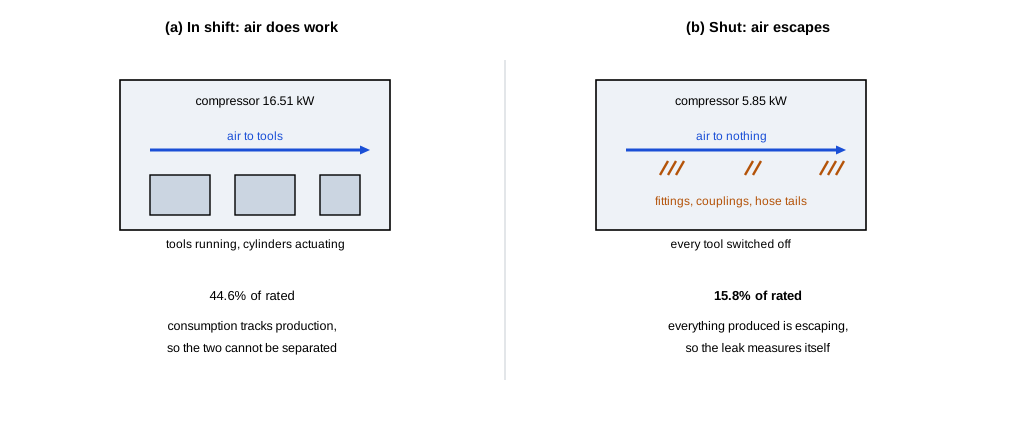
A leak has an unusual property among faults: it is perfectly steady. It does not wait for a hot week or a heavy order. It runs at the same rate on the night of a public holiday as it does at the peak of a shift, which is what makes the closed hours such a clean measurement. During production you cannot separate air that did work from air that escaped. At three in the morning, everything the compressor produces is escaping.
That is the whole method, and it costs nothing to run:
The fix is also unusually cheap. Leaks concentrate in couplings, quick-release fittings, filter and regulator bowls and hose tails. A leak survey with an ultrasonic detector, or simply an hour of walking the lines while the plant is quiet enough to hear them, finds most of them.
The numbers below are a worked example, not a promise. Put your own tariff in.
At 1,404 kWh a month the annual figure is
Apply your own cost per kilowatt hour. Whatever that number is, it recurs every year until somebody fixes the fittings, and it has been recurring for as long as the compressor has been installed.
The asymmetry is the argument again. The measurement is one clamp meter or one already-installed compressor controller reporting load. The saving is a fraction of a bill you are already paying and have never itemised, and the repair is consumables.
Load during closed hours
The single most valuable number on the machine. Everything it produces while the plant is shut is escaping.
Cumulative energy
Turns a load reading into a bill. Watch whether the counter ever goes flat, and when.
Duty cycle and starts
A compressor cycling frequently at low demand is either oversized or feeding leaks, and the two need different answers.
Discharge temperature and vibration
The mechanical health of the machine itself, which is a separate question from what it is being asked to do.
The same instrument set on other rotating plant asks different questions. A production line drive motor is watched for bearing wear rather than for waste. An injection moulding machine is watched for the short stoppages nobody logs, and a CNC machine tool for utilisation against what was quoted, which is its own post.
If it is the supply rather than the machine you suspect, UPS and power quality covers what an incoming board records that an outage log does not, in the post on voltage sags.
The reasoning here is a standard estimation move: bound a quantity you cannot measure directly by measuring it under conditions where every other contribution is zero. The estimation and uncertainty lesson works through the general form of it.
The device page shows the live readings, the charts above in their interactive form, and the alert history. If the device link below ever stops resolving, the public device gallery lists everything currently shared, and devices come and go from it as owners decide.
To put your own compressor on a chart, you can send readings without creating an account and see them arrive on a live chart in a couple of minutes, or read how to connect a first device.
Open this device Monitor your own equipment
Comments