Reaction forces
Read the support reactions at A and B (or the wall reaction and moment for a cantilever) for any combination of point loads and distributed load, computed from equilibrium.
Every textbook beam problem gives you one answer for one fixed loading. Change the span, shift a load, or swap the cross-section and you restart the algebra by hand, redraw the shear-force and bending-moment diagrams from scratch, and still cannot see where the critical section actually falls until the very end. This simulator makes the analysis move: drag any parameter and the shear-force diagram, bending-moment diagram, deflected shape, and bending stress all update live, with the critical section marked automatically. #BeamAnalysis #SolidMechanics #StructuralDesign
Open SimulatorReaction forces
Read the support reactions at A and B (or the wall reaction and moment for a cantilever) for any combination of point loads and distributed load, computed from equilibrium.
Shear-force and bending-moment diagrams
The full shear V(x) and moment M(x) profiles along the span, with the critical section (peak moment) marked by a dashed vertical line on every chart.
Bending stress and deflection
Maximum bending stress at the outermost fibre of the cross-section, the deflected shape along the span, peak deflection and its location, and the span-to-deflection stiffness ratio.
Safety check
Enter an allowable stress and read a live safety factor. The bending-stress chart overlays the yield line and flags overstress immediately.
Animated probe sweep Press the Probe button to sweep a section marker along the span and read the local shear and moment at every point. The deflected shape is exaggerated for clarity throughout.
Live result readouts Every result updates as you drag any slider: reaction forces RA and RB, maximum shear Vmax, maximum moment Mmax and its position, maximum deflection and its position, second moment of area I, section modulus S, maximum bending stress, and the safety factor.
Four analysis charts in two tab groups The Diagrams group holds the shear-force chart (V vs. x) and the bending-moment chart (M vs. x). The Response group holds the deflection chart (y vs. x) and the bending-stress chart (sigma vs. x) with the yield line overlaid. Per-chart PNG export is available on every panel.
Four beam presets Switch between realistic starting configurations with a single click: two point loads on a simply-supported beam, uniformly distributed load on a simply-supported beam, cantilever with a tip point load, and cantilever with a full-span distributed load.
A/B beam comparison Save the current beam as Beam A, then change the span, cross-section, or loads to configure Beam B. Both datasets overlay on every chart as dashed and solid curves so you can see exactly how each change moves the diagrams.
Downloadable resources A lab report with watermark-free beam diagram and all four charts (as Markdown, PNG images, and a DOCX converter), a full span-by-span CSV dataset, and a design-data sheet with reactions, peak moment, safety factor, and a probe-sweep animation video.
| Preset | Support | L (mm) | P1 (N) | a1 (mm) | P2 (N) | a2 (mm) | w (N/mm) | b (mm) | h (mm) | E (GPa) | Represents |
|---|---|---|---|---|---|---|---|---|---|---|---|
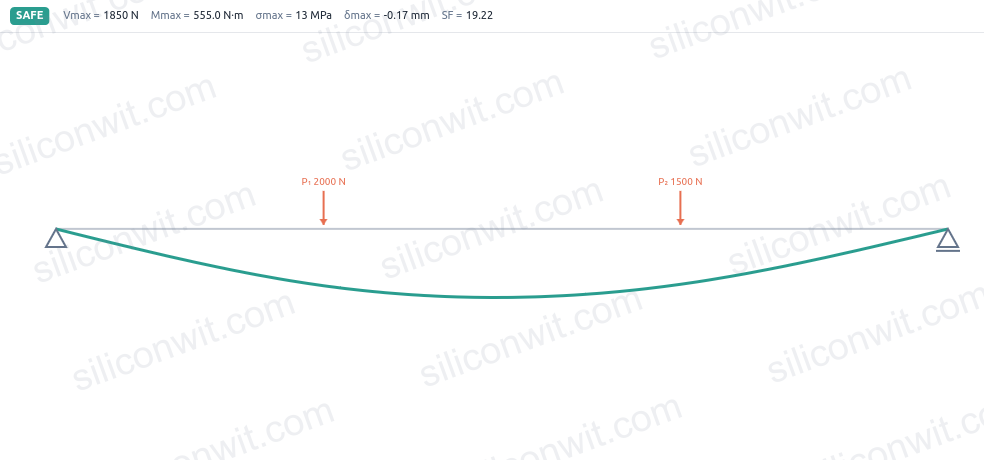
| Two point loads | Simply supported | 1000 | 2000 | 300 | 1500 | 700 | 0 | 40 | 80 | 200 | Steel beam with two off-centre loads |
| Uniformly loaded | Simply supported | 1200 | 0 | 600 | 0 | 600 | 5 | 50 | 100 | 200 | Floor beam under full-span distributed load |
| Cantilever, tip load | Cantilever | 800 | 1200 | 800 | 0 | 400 | 0 | 30 | 60 | 200 | Bracket or shelf with end point load |
| Cantilever, distributed | Cantilever | 700 | 0 | 350 | 0 | 350 | 4 | 40 | 80 | 69 | Aluminium cantilever under full-span load |
Second moment of area and section modulus for a rectangular cross-section (b wide, h deep):
I = b * h^3 / 12 (mm^4)c = h / 2 (mm, distance to outermost fibre)S = I / c (mm^3, section modulus)Support reactions, equilibrium about the left support (x = 0):
Simply supported:  sum of loads:  W = P1 + P2 + w * (wb2 - wb1)  moment arm:    M_about_0 = P1*a1 + P2*a2 + w*(wb2-wb1)*((wb1+wb2)/2)  RB = M_about_0 / L  RA = W - RB
Cantilever (fixed at x = 0):  RA = W  M0 = -M_about_0        (reaction moment at the wall)
Shear force at position x (up-positive, evaluated just to the right of x):
V(x) = RA - P1 if x > a1 - P2 if x > a2 - w * max(0, min(x, wb2) - wb1) if x > wb1Bending moment at position x (sagging-positive):
M(x) = M0 + RA*x - P1*(x - a1) if x > a1 - P2*(x - a2) if x > a2 - w*len*(x - (wb1+xx)/2) if x > wb1 where xx = min(x, wb2), len = max(0, xx - wb1)Maximum bending stress at the critical section (peak moment location):
sigma_max = |M_max| * c / I (MPa)safety_factor = sigma_allowable / sigma_maxDeflection by numerical double integration of the elastic curve equation:
EI * d^2y/dx^2 = M(x)EI = E * I       (E in MPa = N/mm^2, I in mm^4, EI in N*mm^2)
Boundary conditions: Simply supported: y(0) = 0, y(L) = 0 Cantilever: y(0) = 0, dy/dx(0) = 0Work through the structured experiments in the Beam Analysis Experiments lesson for Python-verified exercises that pair directly with this simulator:
Comments