

Tank level
The quantity. On its own it tells you when to order fuel and nothing about where the last tank went.
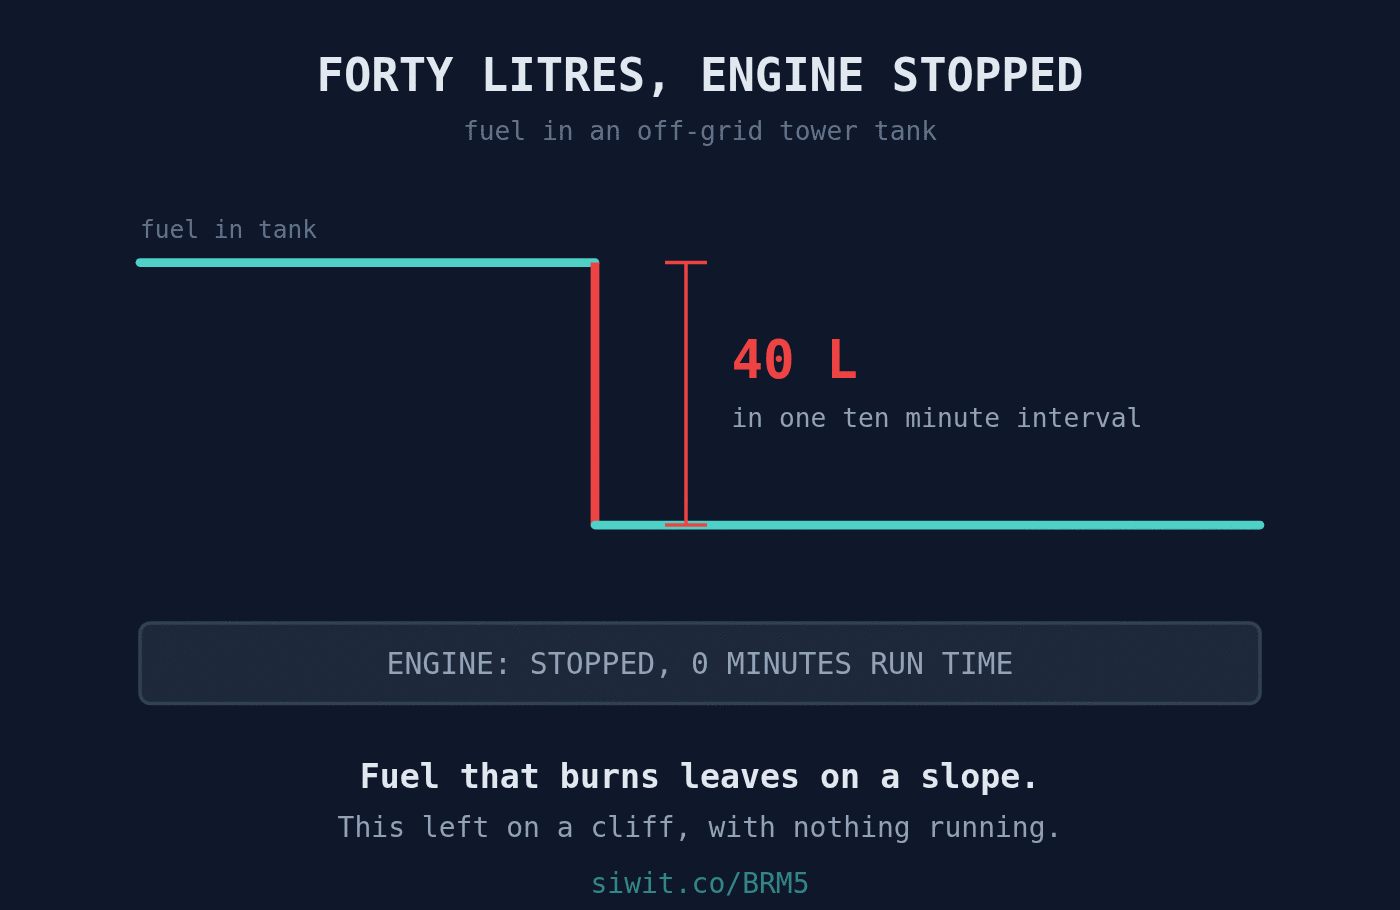
Most monitoring is about condition: is the machine wearing out, is the room too warm, is the pump about to fail. This installation is monitored for a different reason, and it is one that comes up constantly in the field and almost never in the brochures. It is monitored because the fuel kept going missing and nobody could prove anything. #Energy #RemoteMonitoring #OffGrid
A telecoms tower site with no grid connection at all. Solar and a battery bank carry most of the load, and a diesel generator fills the gap. Site load runs steadily at about 2.5 kW.
The owner’s account of why it is instrumented is unusually direct: they lost about 200 litres over two months before the monitoring went in. Not a leak they could find, not a consumption figure that made sense, just a tank that emptied faster than the engine could explain.
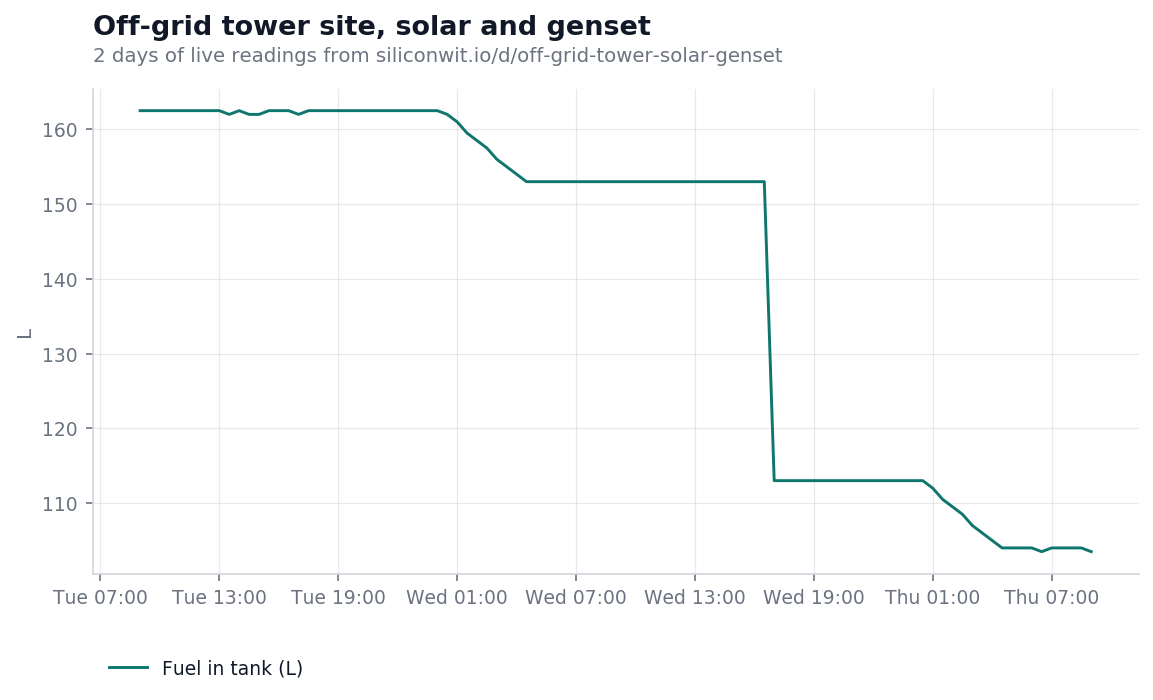
This is two days of tank level, and it contains both shapes.
The gentle downward slopes are consumption. When the generator runs, fuel leaves the tank at a rate the engine can account for, and the line falls at an angle. You can see one of those between roughly Wednesday 01:00 and 04:00, taking the level from about 162 L down to 153 L.
Then, late on the Wednesday afternoon, the line goes vertical. The level drops from 153 L to 113 L between one reading and the next. Forty litres, in a single ten minute reporting interval.
No engine burns forty litres in ten minutes at a site drawing 2.5 kW. Whatever that was, it was not consumption, and the shape alone says so before any other reading is consulted.
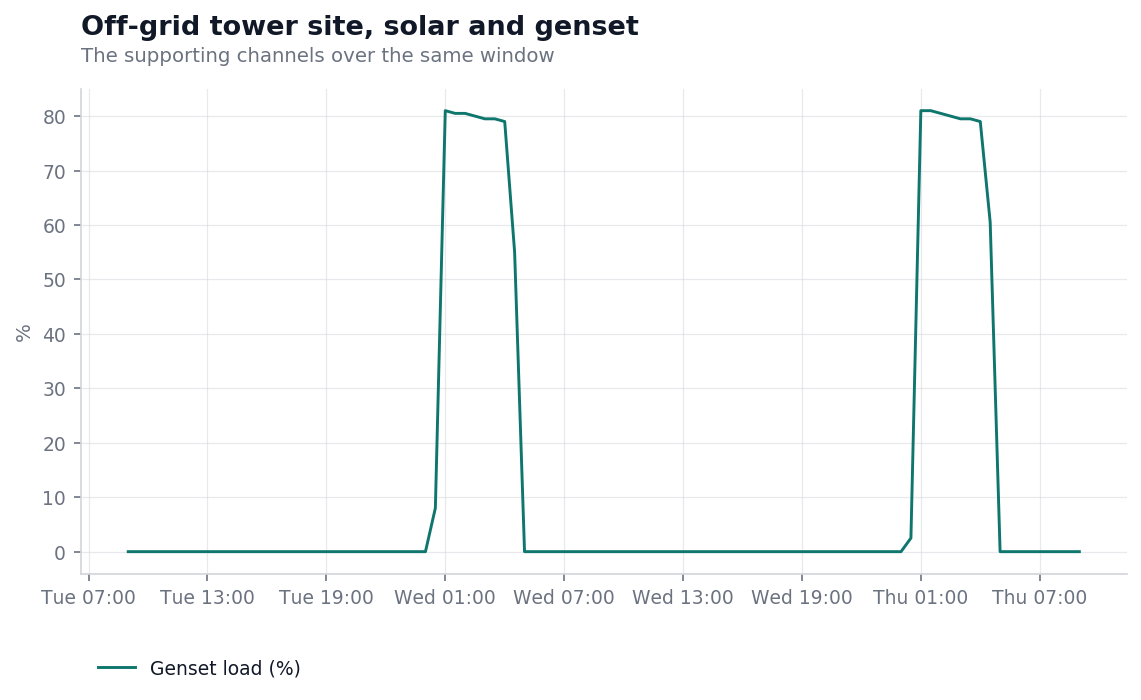
Here is generator load across the identical window.
At the moment the tank lost forty litres, the generator was at 0% load, with 0 minutes of run time recorded in that interval. The engine was not running. It had not been running. Forty litres left a tank attached to a stopped engine.
That is the entire finding, and notice how little interpretation it required. One reading gave the anomaly, a second reading eliminated the innocent explanation, and the conclusion is what is left.
Across the full month this happened exactly twice:
Ninety two and a half litres, both events in the afternoon, both with the engine cold. Set that against the owner’s recollection of roughly 200 litres over two months before monitoring and the numbers agree with each other rather too well.
The useful idea here generalises well beyond diesel, and it is worth stating plainly.
A tank level on its own is a fuel gauge. It tells you when to order. It is genuinely useful and it is not what caught this.
What caught this is that the site reports both a quantity and the reason that quantity should change. Engine hours went from 872.0 to 989.0 over the month, which is 117 hours of running. Multiply that by the set’s burn rate and you have the litres the engine can account for. Anything the tank lost beyond that figure has to be explained some other way, and the difference is not an opinion, it is arithmetic.
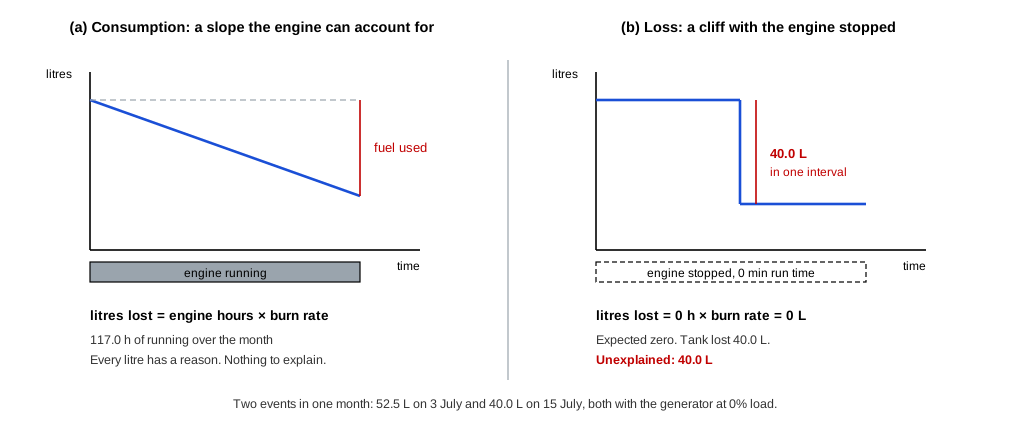
This is the same structure as stock reconciliation in a warehouse or metered water against billed water in a network. One reading for what you have, one reading for what should have moved it, and the discrepancy is the finding. Any system that reports only the first can be argued with. A system that reports both cannot.
It also changes what happens next. Without the second reading, the owner has a suspicion and a bad atmosphere on site. With it, they have a timestamp, a quantity and an engine state, and the conversation is about a specific Wednesday afternoon rather than about people’s honesty in general.
The numbers below are a worked example, not a promise. Put your own figures in.
Take the observed rate, 92.5 litres in a month, priced at a conservative USD 1.20 per litre:
Against that:
The honest framing is that this device does not prevent anything by itself. It removes the ambiguity that made the loss survivable, and the loss stops shortly afterwards.
Tank level
The quantity. On its own it tells you when to order fuel and nothing about where the last tank went.
Engine hours and run time
The reason the quantity should change. This is the reading that turns a level into an audit.
Rate of change
Alert on litres per interval, not on litres remaining. Consumption is a slope and a siphon is a cliff.
Battery state of charge
Explains why the generator started at all. A bank that is degrading makes the engine run more, which raises fuel use honestly.
The other energy installations measure different things for different reasons. Bulk fuel storage runs the same reconciliation at a much larger scale on a 30,000 litre tank, where the owner watches days of stock rather than litres and checks deliveries against invoices. Commercial rooftop solar inverts the question and compares yield against irradiance, on the basis that a shortfall usually means the panels want washing. UPS and power quality went in because equipment kept failing and it turned out to be sags rather than the equipment.
The reconciliation idea shows up in water too. District water metering compares what is flowing against what should be, and treats whatever is still moving at three in the morning as a leak.
The device page shows the live readings, the charts above in their interactive form, and the alert history including both fuel loss events. If the device link below ever stops resolving, the public device gallery lists everything currently shared, and devices come and go from it as owners decide.
To put your own site on a chart, you can send readings without creating an account and see them arrive on a live chart in a couple of minutes, or read how to connect a first device.
Open this device Monitor your own equipment
Comments