



Inflow at each zone inlet
One meter per zone. This is the number that turns a town-wide loss into a location.
A treatment plant knows exactly how much water it sent out. The billing system knows exactly how much was paid for. Subtract one from the other and you have the most useless important number in the industry: a single figure, for a whole town, describing water that went somewhere. It is a real loss and you cannot act on it, because it does not say where, and you cannot dig up a town to find out. #Water #RemoteMonitoring #NonRevenueWater
Water lost between treatment and billing is called non-revenue water. In Kenya it rose from 44% to 48% during 2024/25, according to the regulator’s most recent performance report. Roughly half of all treated water earns nothing.
It leaves through three doors. It leaks from buried pipe, which is a physical loss. It reaches a customer and is never billed, through an under-registering meter or an illegal connection, which is an apparent or commercial loss. And a portion is used legitimately but not charged for.
Those need completely different responses. A leak needs excavation. An unbilled connection needs an auditor and a new meter. Sending the wrong crew is expensive, and the town-wide figure cannot tell you which is which.
The method is old and the instrumentation is what changed. You divide the network into district metering areas, each fed by a single inlet pipe, and you meter that one pipe. Not the houses. The inlet.
Now the same subtraction runs per zone. Here are three zones of one network over ten weeks, each metered on its inlet, with the volume billed inside the zone alongside it:
| Zone | Inflow | Billed | Loss | Share lost |
|---|---|---|---|---|
| Residential | 359.8 L/min | 311.8 L/min | 48.0 L/min | 13.3% |
| Older mains | 592.7 L/min | 245.1 L/min | 347.7 L/min | 58.7% |
| Commercial | 495.2 L/min | 285.9 L/min | 209.3 L/min | 42.3% |
Together they behave exactly like the town-wide figure everyone already has:
which is a number you can do nothing with. Split three ways, it is a work order. One zone is healthy at 13.3% and needs nothing. Two are losing heavily and need attention now. That is the entire argument for zoning, and it needs one meter per zone rather than one per customer.
Every figure in this post is measured over one fixed window, 28 May to 7 August 2026, which is the window the charts show. Naming it matters: these devices keep running, so a claim about “the last ten weeks” stops being true the week after it is written, while a claim about a named window stays checkable against the chart above it forever.
Knowing that two zones are bleeding does not tell you what to send. That takes one more reading, and it is free once the meter is in.
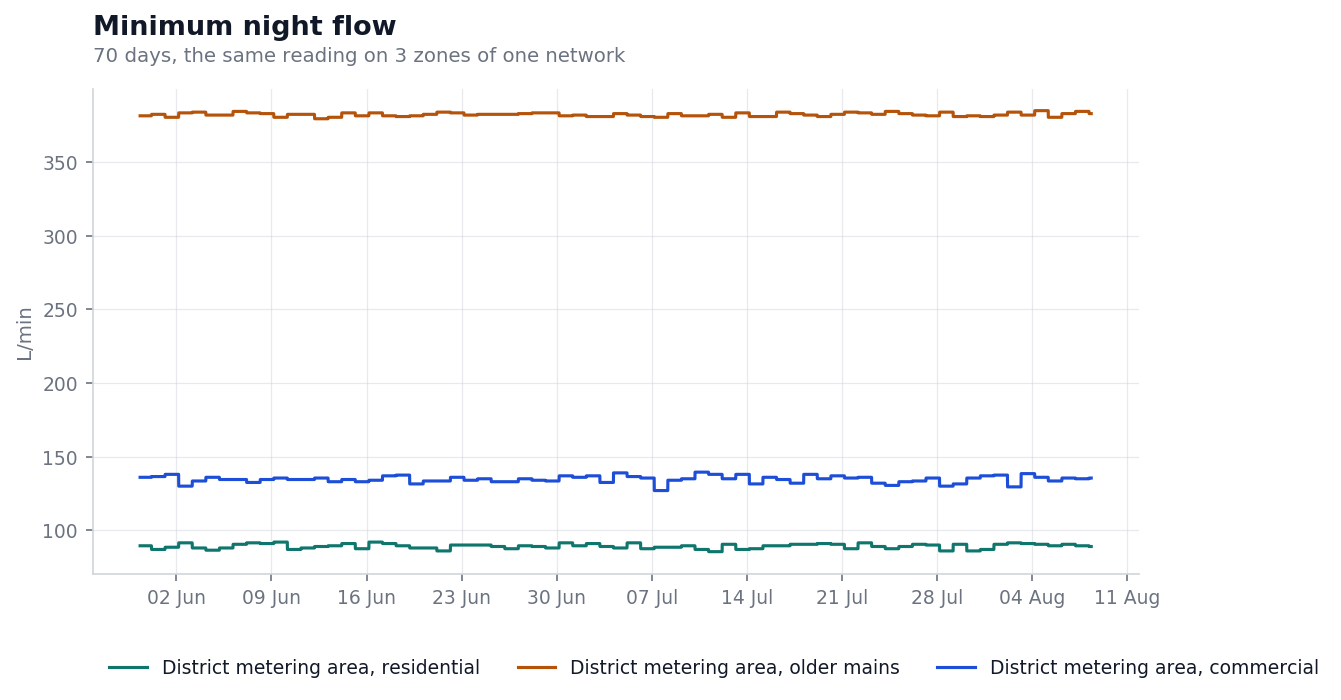
This is minimum night flow, the lowest flow each zone sees between two and four in the morning, when legitimate demand is close to zero. Whatever is still moving then is not going into anyone’s cup.
Against each zone’s own inflow:
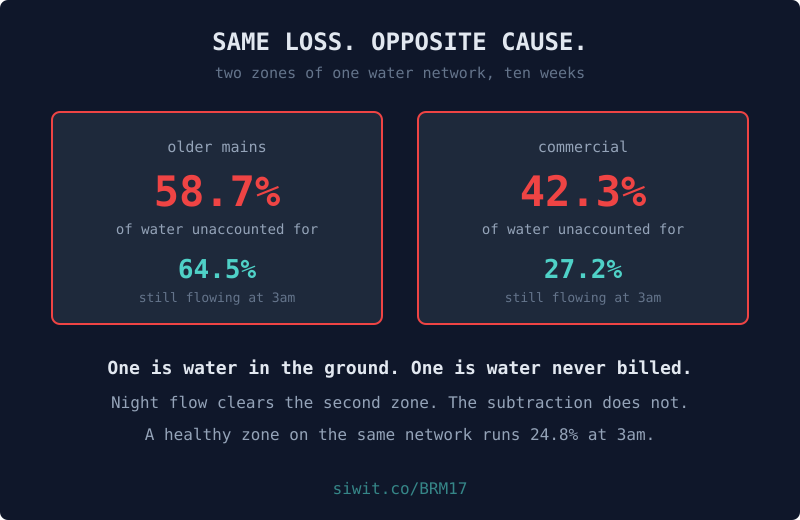
Read those three lines carefully, because they are the point of the post. The older mains zone is running at nearly two thirds of its daytime inflow in the middle of the night. That is water in the ground.
The commercial zone, which loses 42.3% of everything entering it, sits at 27.2%, which is indistinguishable from the healthy zone’s 24.8%. Night flow clears it. If minimum night flow were the only reading you had, you would strike it off the list and send your crew somewhere else.
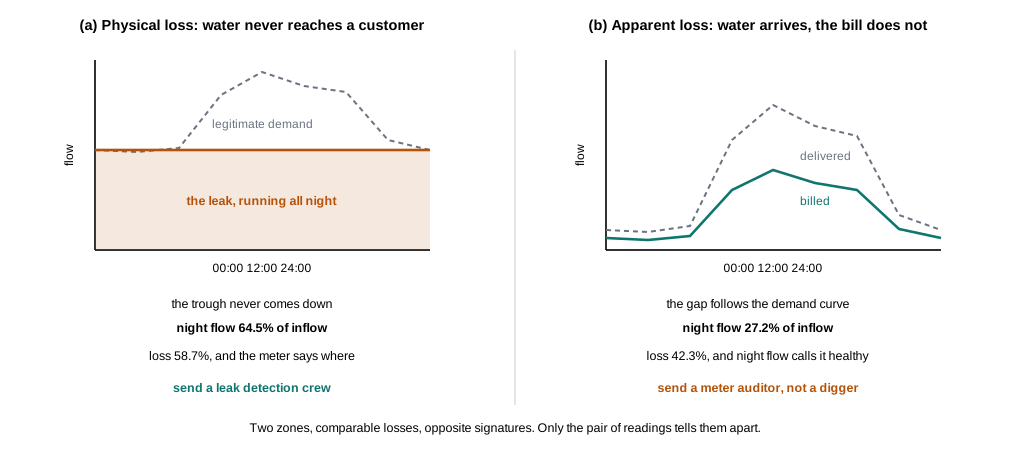
A hole in a pipe does not keep office hours. It discharges at the same rate at three in the morning as at noon, so it adds a constant to every hour and lifts the overnight trough, which is exactly where there is nothing else to hide it.
Water that is delivered and never billed behaves in the opposite way. It goes through somebody’s tap, so it follows the demand curve. At three in the morning that customer is asleep and the zone looks healthy, because in the physical sense it is: the pipes are sound. The loss is in the ledger, not the ground.
So the two readings answer two different questions, and you need both:
A zone that is high on both is leaking. A zone that is high on the first and normal on the second is being under-billed, under-metered, or tapped.
The numbers below are a worked example, not a promise. Put your own figures in.
Across the three zones the loss runs at 605.0 L/min continuously:
Apply your own cost per cubic metre, and remember it is production cost rather than tariff, since the water was abstracted, treated and pumped before it was lost.
What monitoring changes is not the size of that number but whether it has an address:
The instrumentation is modest, which is the other half of the argument. A town needs a meter on each zone inlet, not on every customer. Those inlets sit at reservoirs and pump stations that generally already have power and a locked compound, which removes most of the hard problems in field deployment.
Inflow at each zone inlet
One meter per zone. This is the number that turns a town-wide loss into a location.
Billed volume for the same zone
Without it the inflow is just consumption. The subtraction is what makes it a loss figure.
Minimum night flow
Between about 02:00 and 04:00, one value per day, compared against the zone’s own inflow rather than against a fixed limit.
Zone inlet pressure
Leakage rises with pressure, so pressure management is often the cheapest first intervention on a leaking zone.
The three zones here are residential, older mains and commercial, all on the public gallery. A fourth meter, district water metering, is watched for a different question entirely: not where the loss is, but whether it is growing, which is its own post.
At the other end of the same system, a borehole and storage tank is about the pump rather than the network, covered in the pump that ran dry, while building water storage and tenant water monitoring run the same argument at the scale of a single block.
Separating two causes that produce the same headline number is a mechanism question rather than a statistical one, which is the distinction the correlation, causation and evidence lesson is built around.
Each zone has its own device page with live readings, the charts above in their interactive form, and the alert history. If a device link ever stops resolving, the public device gallery lists everything currently shared, and devices come and go from it as owners decide.
To put your own zone meter on a chart, you can send readings without creating an account and see them arrive on a live chart in a couple of minutes, or read how to connect a first device.
Open the leaking zone Monitor your own network
Comments