

Detector health or sensitivity
The channel that makes a zero meaningful. Alert on it falling, and treat the alert as seriously as a gas alert.
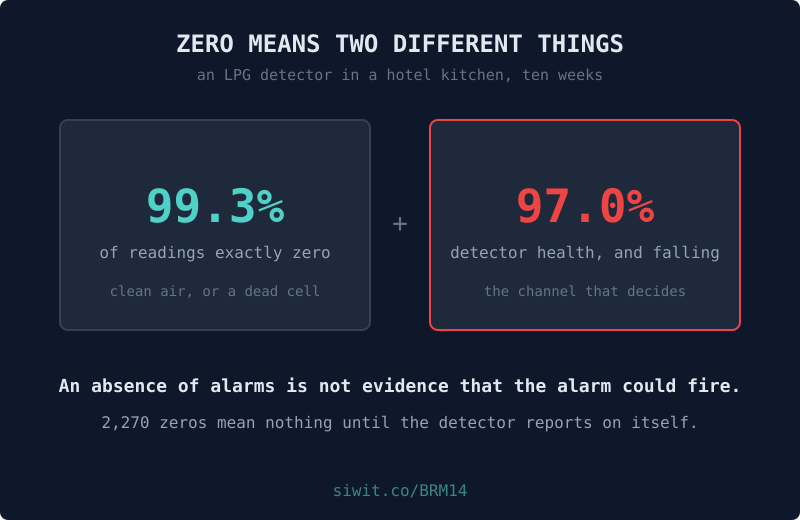
Almost every fault in monitoring announces itself by producing an unusual reading. This one produces the most usual reading there is. A gas detector whose sensing element has reached the end of its life outputs zero, calmly and consistently, in exactly the same way as a detector watching clean air in a well-run kitchen. Nothing alarms. Nothing looks wrong. The dashboard is green, and it will stay green through the one event it was bought for. #EnvironmentAndSafety #RemoteMonitoring #GasDetection
An LPG detector in a hotel kitchen, with the extraction status alongside it so the two can be read together, and a separate channel reporting the detector’s own condition.
The owner’s description of it is the whole problem in one line: it reads zero nearly always, and that suits them fine.
Every figure in this post is measured over one fixed window, 28 May to 7 August 2026, which is the window the charts show. Naming it matters: these devices keep running, so a claim about “the last ten weeks” stops being true the week after it is written, while a claim about a named window stays checkable against the chart above it forever.
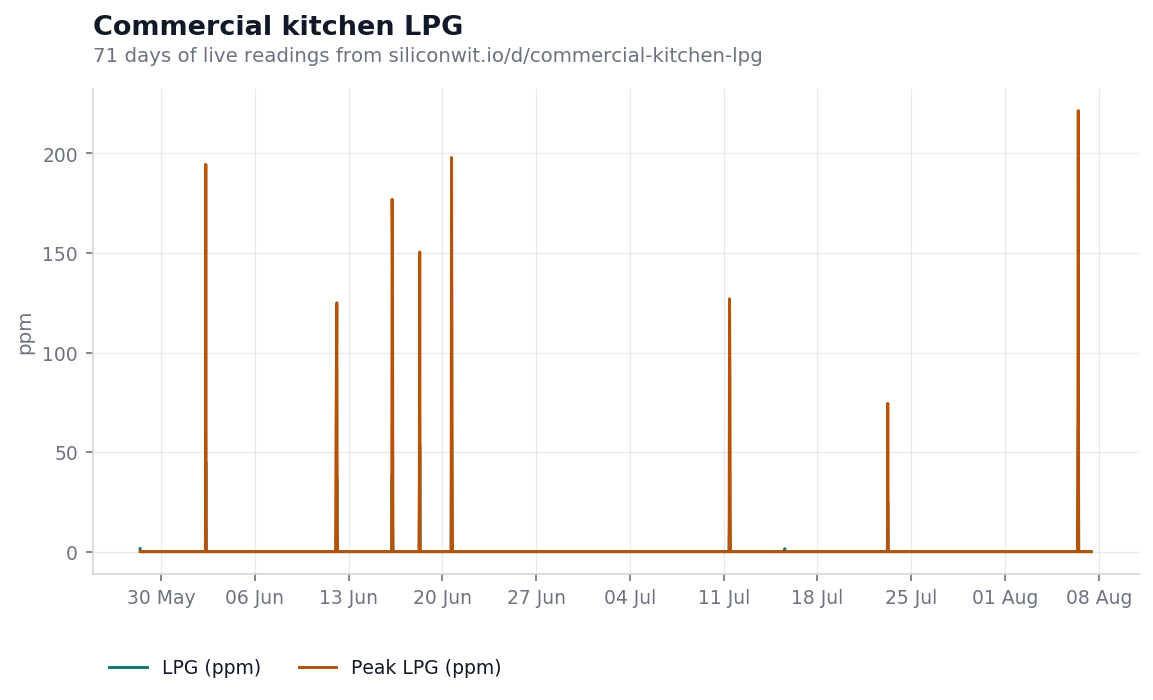
This is the gas channel. It is flat on zero.
Fifteen readings in ten weeks were non-zero, the largest of them 61.5 ppm, which is a burner lit badly or a cylinder changed with the door shut. Everything else is zero.
Read that chart honestly and ask what you have learned. You have learned that the number coming out of this device is zero. You have not learned that there is no gas in the kitchen, because those are different claims, and the gas channel cannot distinguish them. A detector with a disconnected sensing element, a poisoned catalytic bead, or an electrochemical cell past its service life produces this chart exactly.
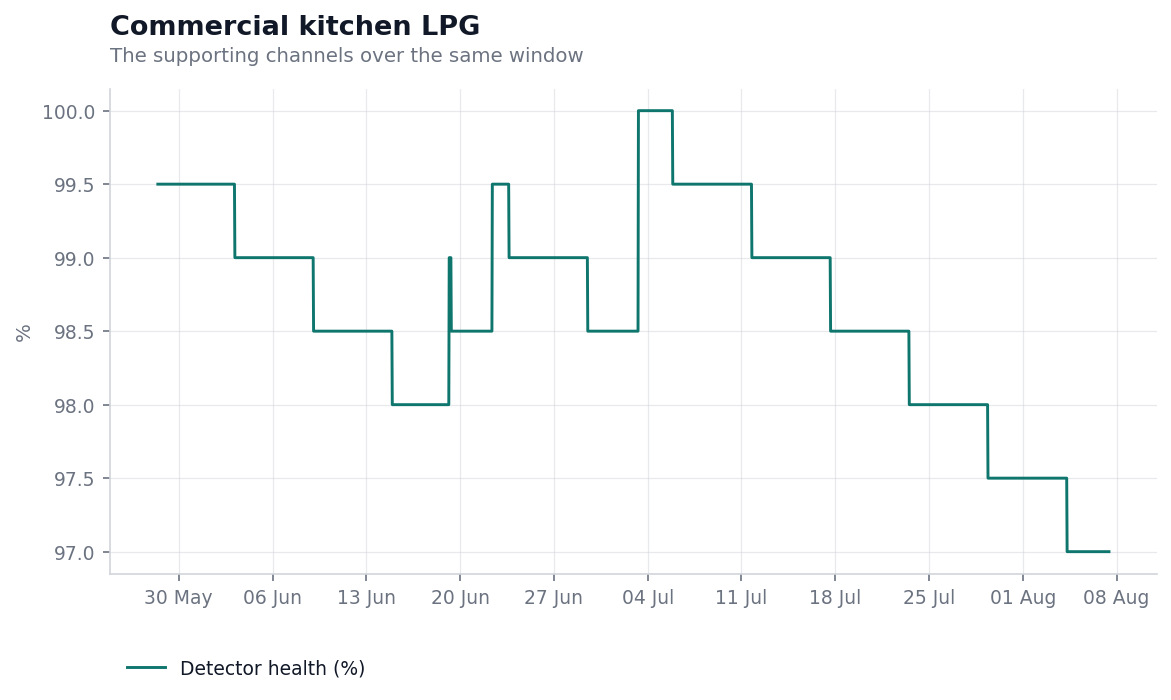
Same device, same ten weeks, different question. This is the detector reporting on itself.
It declines. It starts at 100.0%, falls steadily, steps back to 100.0% at a recalibration on 3 July, and resumes falling to 97.0% by the end of the window. That sawtooth is the shape of a healthy maintenance regime: a consumable degrading, being serviced, and degrading again.
Those two charts together say something neither says alone. The gas chart says nothing was detected. The health chart says the thing that detected nothing was capable of detecting something. Only the pair is evidence.
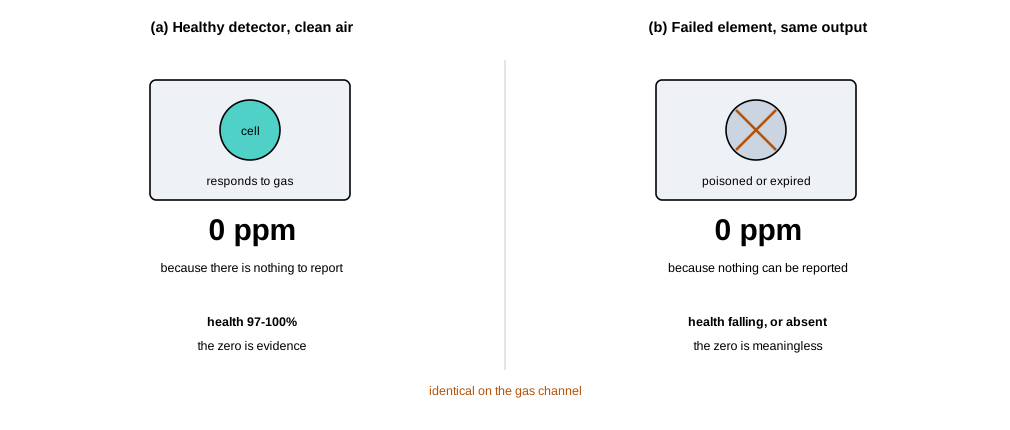
This generalises well beyond gas, and it is worth stating in its general form: an absence of alarms is not evidence of absence of a problem unless you have independent evidence that the alarm could have fired.
The same trap sits in every quiet monitoring channel:
In every case the reassuring output and the failure produce the same picture. The instrument reporting on its own condition is the only thing that separates them, which is why a health channel and a heartbeat are worth as much as the measurement.
The numbers below are a worked example, not a promise. Put your own figures in.
The asymmetry here is unlike the others in this series, because the loss is not a repair bill. A gas detector exists for an event whose cost is measured in a kitchen fire, an insurance position, and people. The value of the health channel is not that it saves money on any ordinary day. It is that it converts a device you are hoping works into a device you know works, on the day when the difference is the only thing that matters.
The practical version, which costs almost nothing:
Detector health or sensitivity
The channel that makes a zero meaningful. Alert on it falling, and treat the alert as seriously as a gas alert.
Reporting heartbeat
A device that has gone quiet looks identical to a device with nothing to say. Alert on the silence.
Window peak, not just the average
A short excursion averages away to almost nothing. The peak inside each window is what survives.
Extraction state alongside the gas
Gas rising while extraction is running is a much worse signal than gas rising while it is off, and the pair tells you which.
The other detectors run the same argument in different rooms. Fuel depot vapour monitoring sits vapour and extraction status side by side so it is clear which one is the problem. Car park carbon monoxide uses the readings to drive the fans instead of a timer, which is its own post.
For the same trap in a very different form, a laboratory incubator holds a tight setpoint where a short overnight excursion invalidates a week of work and leaves no trace, covered in the post on data integrity.
The reasoning error this post is about has a name. Treating “no alarm” as “no hazard” is the same move as treating an absence of evidence as evidence of absence, and the logical fallacies in engineering arguments lesson works through why it is so persuasive and so wrong.
The device page shows the live readings, the charts above in their interactive form, and the alert history including the excursions this post counts. If the device link below ever stops resolving, the public device gallery lists everything currently shared, and devices come and go from it as owners decide.
To put your own detector on a chart, you can send readings without creating an account and see them arrive on a live chart in a couple of minutes, or read how to connect a first device.
Open this device Monitor your own equipment
Comments