

Internal and peak temperature
Against a tight setpoint, alert on deviation in both directions. Too cold invalidates as thoroughly as too warm.
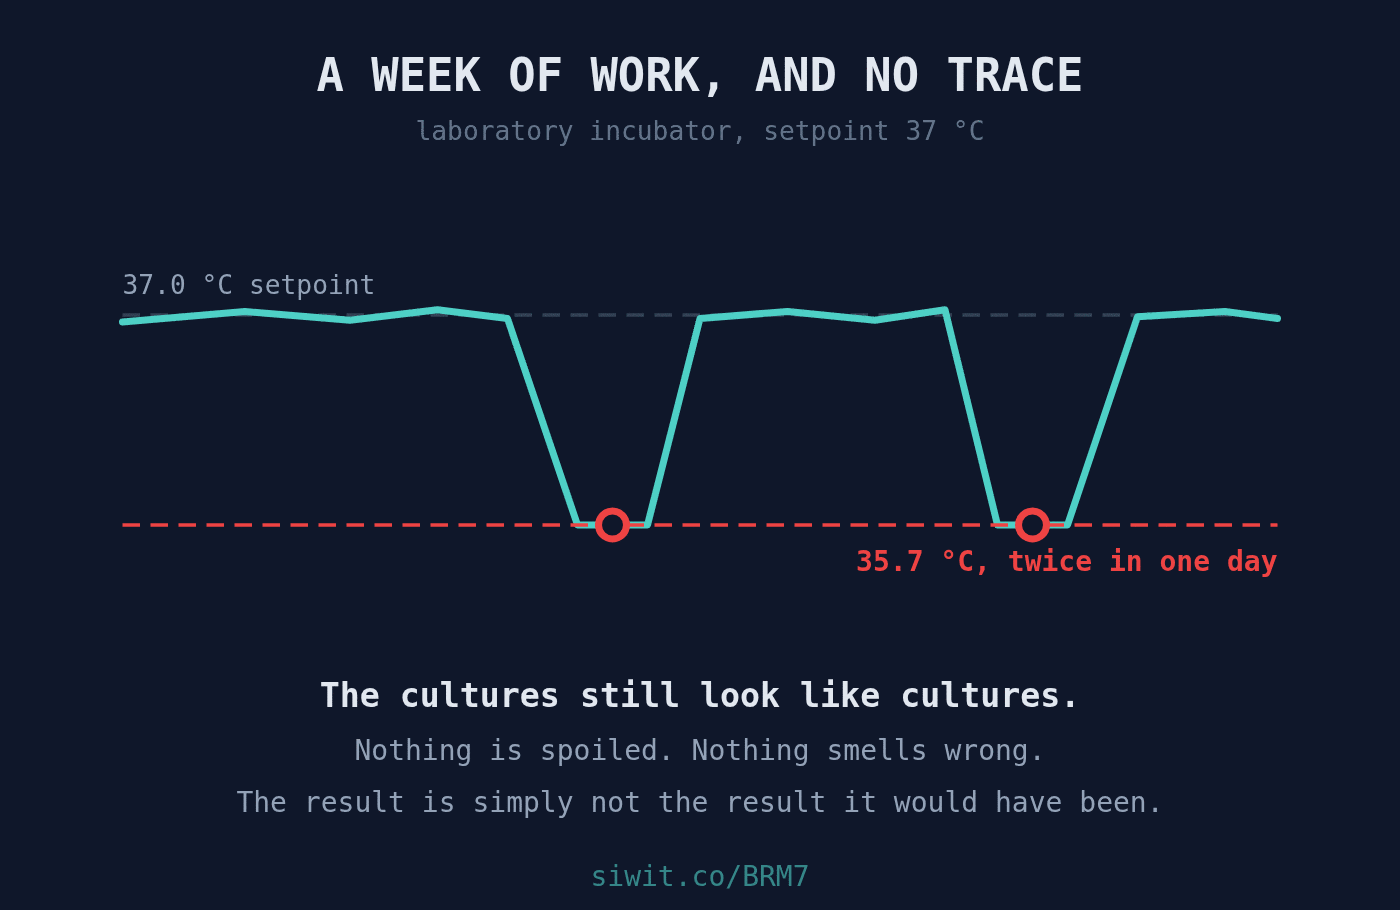
Almost every other installation in this series is monitored to protect a physical thing: a pump, a consignment, a room full of stock. This one is monitored to protect a conclusion. The equipment is cheap by laboratory standards and the contents are worth very little. What is at risk is whether anybody can believe the result. #Research #RemoteMonitoring #DataIntegrity
A laboratory incubator holding 37 °C to a tight tolerance. The owner states the risk precisely: a short excursion overnight invalidates a week of work and you would never know.
That last clause is the reason this device exists. Held above ambient rather than below it, an incubator that drifts leaves no evidence behind. Cultures that grew at the wrong temperature look like cultures. They do not smell wrong, they are not visibly spoiled, and they will go into an analysis exactly as if nothing had happened.
Over a normal three day window this unit sat at a mean of 37.33 °C, within a band from 36.5 to 38.1. That is the shape of an instrument doing its job.
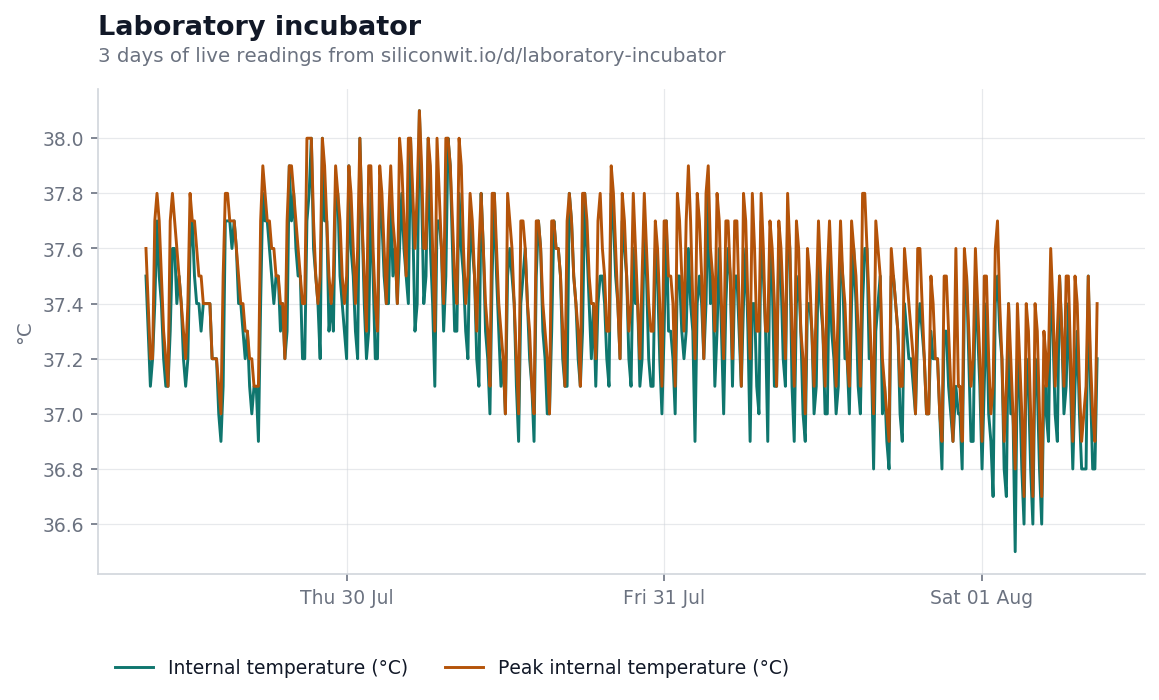
Three days of internal and peak temperature. The two lines sit almost on top of each other in a narrow band, and there is nothing to see, which is the point of showing it first.
You cannot judge an excursion without knowing the width of normal. A drop of one and a half degrees would be unremarkable in a cold store and invisible in a greenhouse. Here, against a band this tight, it is the largest thing that happened all month.
This is also why the peak reading is worth carrying. Internal temperature is the value at the moment of sampling. Peak is the highest reached within the reporting window. Between two samples ten minutes apart, an incubator can be opened, emptied, refilled and closed, and the instantaneous reading may catch none of it. The peak catches the envelope.
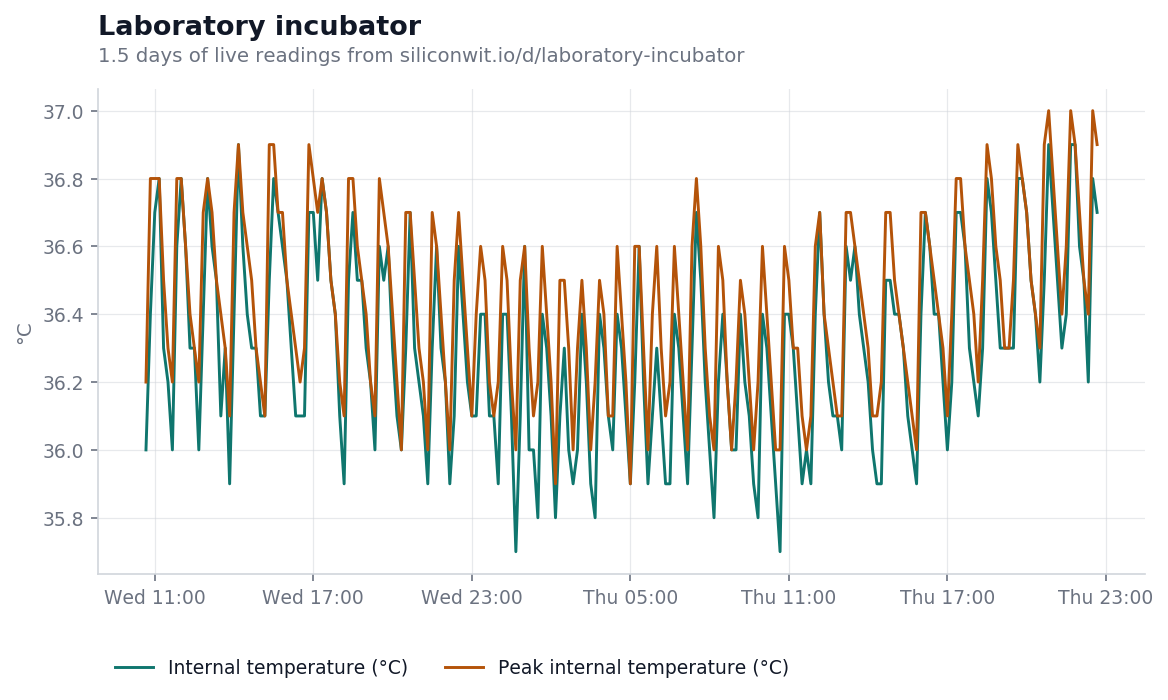
On Thursday 16 July this incubator dropped to 35.7 °C against a 37 °C setpoint, and then did it again the same day. The two events were recorded at 00:40 and 10:40.
Two things about that pattern are worth noticing.
The first is the size:
Set that against the width of the chamber’s own normal band over three days:
The excursion is nearly as large as everything else the incubator does in a week. A drop of 1.3 degrees sounds trivial in ordinary language and is not trivial here. Cell growth rates, enzyme kinetics and doubling times are all temperature dependent, and a culture held below setpoint for part of a run is not the same culture as one held at setpoint throughout. The experiment still produces a number. The number is just not the number it would have been.
The second is the recurrence. One excursion is an event, possibly a door left ajar. Two in a day at roughly ten hours apart is a pattern, and a pattern points at a mechanism: a door seal, a controller cycling wider than it should, a heater relay, a room that gets cold at night. The value of the record is that this question can be asked at all. Without it there is one unexplained result and no way to connect it to anything.
Note also what the chart does not show, which is any excursion upward. This unit’s problem is losing heat, not gaining it, and that narrows the diagnosis considerably before anyone opens a panel.
It is worth being precise about the value here, because it is not the same as in the other posts in this series.
For a cold store, the record protects the stock, and the stock has a price per kilogram. For a laboratory, the record protects the right to make a claim. Its value shows up in three places:
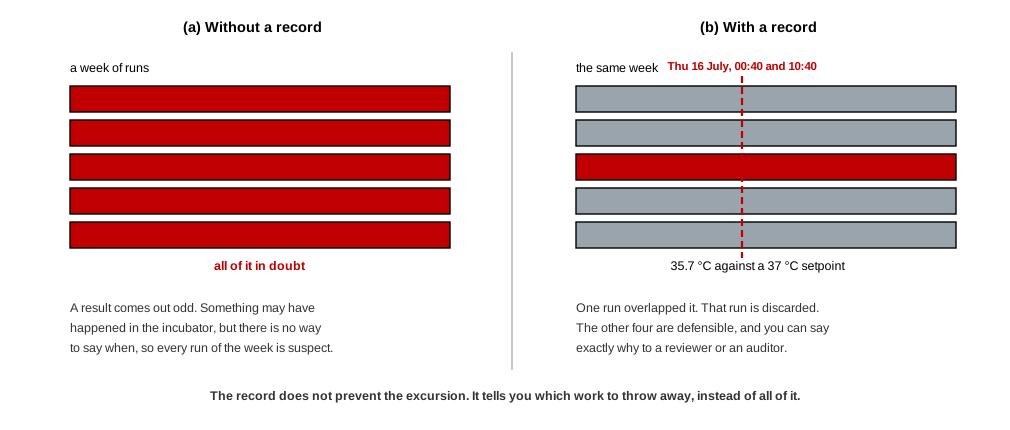
Discarding the right work, not all of it. When an excursion is documented with a start, an end and a magnitude, you can identify which runs overlapped it. Without a record, a suspicious result leaves you with a choice between defending work you cannot vouch for and rerunning everything from the period, and the second option is what usually happens.
Answering a reviewer or an auditor. Any regulated or published work eventually attracts the question of how storage and incubation conditions were assured. A continuous record answers it in one line. A logbook of daily spot checks does not, because the failure this post describes happened at 00:40.
Catching it before the week is spent. An alert on a 37 °C setpoint with a narrow band reaches somebody the same night. The difference between knowing on Thursday morning and discovering it after analysis is the entire cost of the run.
The numbers below are a worked example, not a promise. Put your own figures in.
Price a week of a research assistant’s time plus consumables at a conservative USD 1,500, and one invalidated run pays for continuous monitoring of several incubators for a year. That arithmetic is not close, and it is not really the strongest argument.
The stronger one is that the alternative failure is undetectable. A pump that fails announces itself. An incubator that drifts for six hours produces a full set of clean looking results, and those results go into a report. The cost of the undetected case is not a wasted week, it is a wrong conclusion carried forward, and there is no line in a budget for that.
Against that:
Internal and peak temperature
Against a tight setpoint, alert on deviation in both directions. Too cold invalidates as thoroughly as too warm.
Door openings and open time
The first thing to check when an excursion appears, and the reading that tells a benign one from a fault.
Ambient temperature
An incubator fighting a cold room at night behaves differently from one in a stable room. This is where that shows.
Humidity
Relevant for anything cultured over days, and a second independent sign that the chamber is sealed.
The other research installations are instrumented for the same underlying reason, which is that an unobserved gap in the record is a gap in the result. A materials test rig was left running over a weekend and its owner found out on Monday that it had stopped on the Friday night, which is this post’s problem with a longer fuse. Campus air monitoring exists to be a clean baseline that the roadside air quality numbers can be held up against, since a measurement with nothing to compare it to supports very little.
The instrument set here is shared with the cold chain, aimed in the opposite direction. A cold store and a server room cooling unit report the same four readings, and ask the same question about whether the box is holding.
The device page shows the live readings, the charts above in their interactive form, and the alert history including both excursions. If the device link below ever stops resolving, the public device gallery lists everything currently shared, and devices come and go from it as owners decide.
To put your own incubator on a chart, you can send readings without creating an account and see them arrive on a live chart in a couple of minutes, or read how to connect a first device.
Open this device Monitor your own equipment
Comments