

Humidity, with duration
The reading is easy and the rule is the hard part. Alert on how long it stays high, not on the moment it crosses.
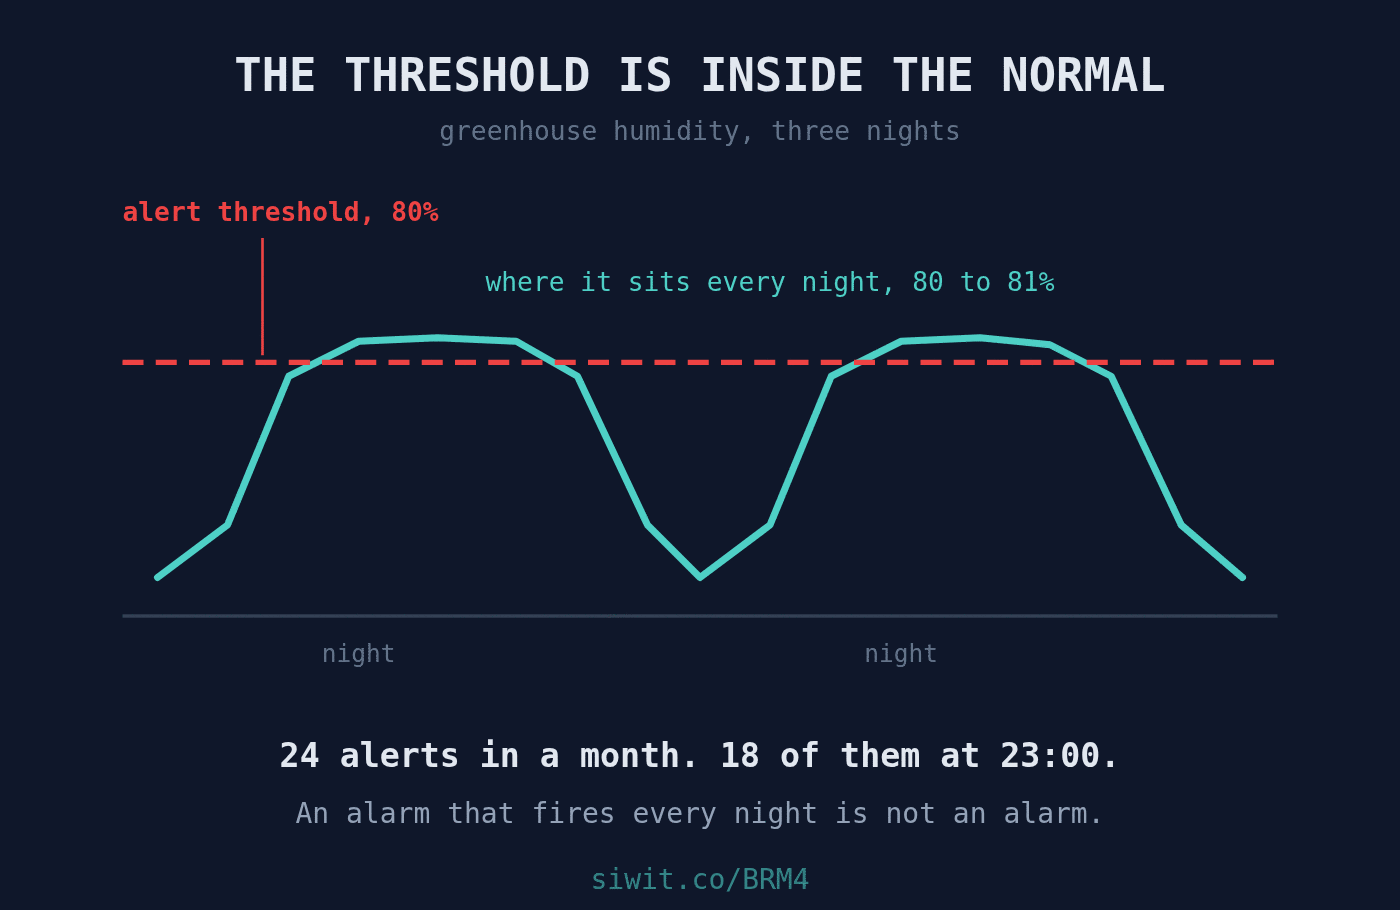
The failure mode of a monitoring system is not usually that it misses something. It is that it tells you something so often that you stop reading it, and then it tells you the one thing that mattered in exactly the same tone of voice. #Agriculture #RemoteMonitoring #Horticulture
Cut flowers under glass, with temperature, humidity, CO2 and vent position all reported. The grower’s summary of the stakes is short: one bad afternoon costs a shipment.
Over the last month this greenhouse raised 30 alerts. Twenty four of them were the same alert, humidity high, spoilage risk. Eighteen of those twenty four arrived at 23:00, and another five at 22:00.
Three quarters of them landed at a single hour of the day:
That distribution is the whole story. A fault does not keep office hours. Something that happens at the same hour on nearly every night of the month is not a fault, it is the climate of the building.
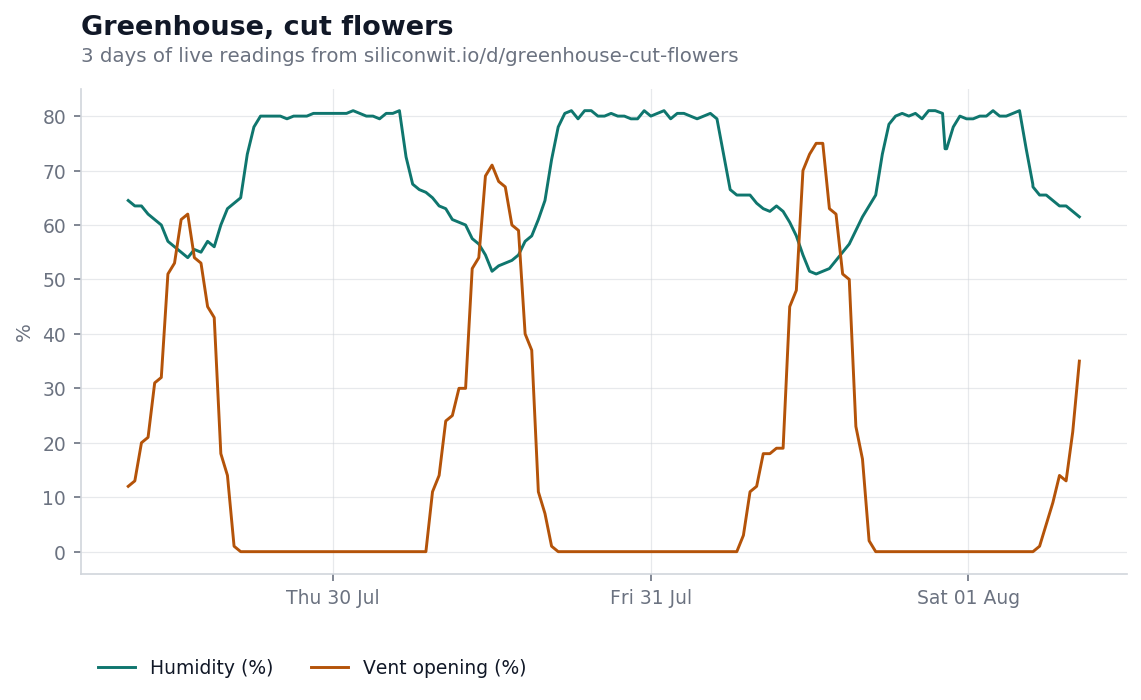
Two readings on one axis because both are percentages, and the relationship between them is the point.
Follow the humidity line first. Every day it is driven down to somewhere in the fifties, and every night it climbs back and then flattens. It does not spike. It plateaus, and it plateaus at the same height each time. Across the nights in this window the mean between 22:00 and 03:00 was 79.8%, and the highest value reached was 81.0%. Through the middle of the day it averaged 56.2%, bottoming out at 51%.
Now follow the vent line. The vents open during the day, reaching 75% at the peak, and they close to zero at night. That is correct behaviour and it is also the mechanism: a sealed glasshouse with plants transpiring inside it and no air exchange will saturate, every night, forever. The humidity plateau is not a malfunction. It is what the building does when the vents shut.
So the alert threshold was set at 80%, and the greenhouse sits at 79.8% every night by design.
A threshold placed at the normal has three costs, and they compound.
The first is that it trains the grower to dismiss the notification. After the fourth consecutive night, the alert stops carrying information and becomes weather. The twenty fifth one, the night the vents jam shut or the heating fails and humidity holds at 88% until morning, arrives in the same envelope as the twenty four that were fine.
The second is subtler. A threshold that fires constantly makes the alert history useless as a record. You cannot look back at a month and ask what happened, because the answer is always the same thing that always happens. The log stops being evidence.
The third is that it hides the reading that actually predicts the loss. Botrytis on cut flowers is not driven by touching 80% for a moment. It is driven by staying high, with still air, long enough for free water to form on the petals. Duration and air movement are the risk. The instantaneous number is not. An alert built on the instantaneous number will fire on every harmless night and stay silent through a genuinely dangerous one that happens to peak at 79%.
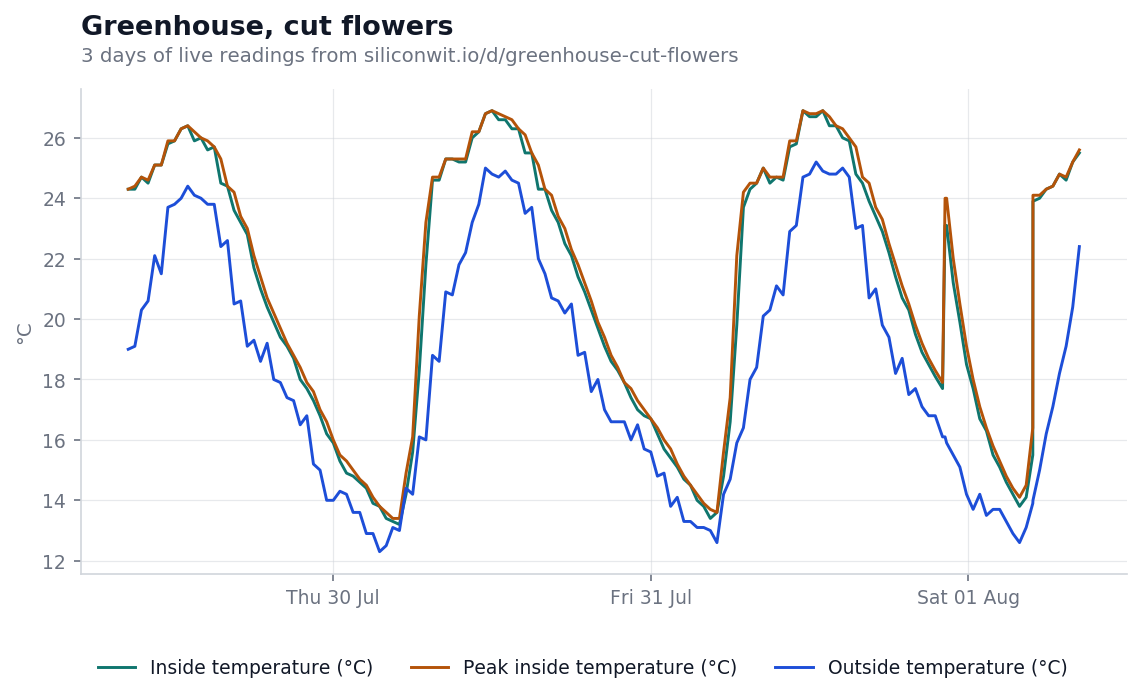
The temperature chart above is the control case for comparison. Inside tracks outside with the greenhouse’s own gain on top, peaking at 26.9 °C against an outside maximum of 25.2 °C, and it raised no alerts at all during this window because its threshold is somewhere it does not normally go.
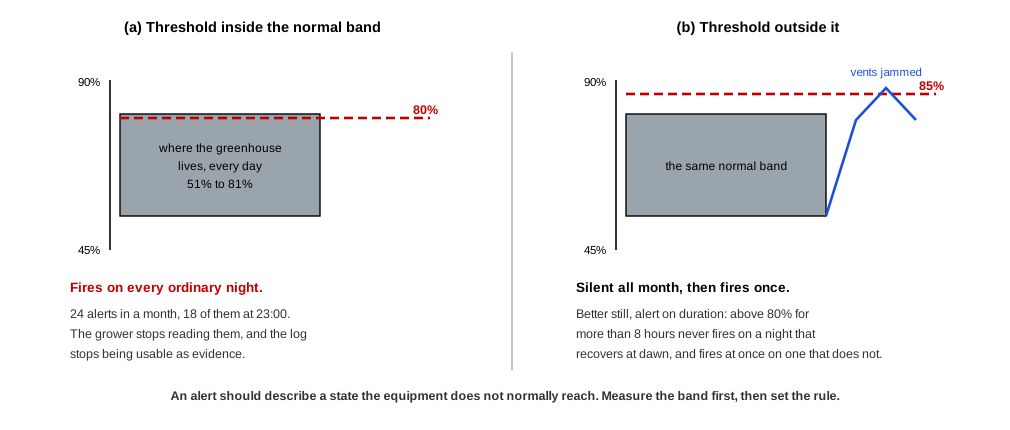
The fix costs nothing but thought, and there are three honest options.
Move the number. The cheapest change. If the greenhouse normally reaches 81%, the alert belongs at 85% or higher, above anything the building produces on its own. This takes five minutes and removes 24 alerts a month. It is also the weakest option, because it still asks a single instantaneous reading to represent a cumulative risk.
Alert on duration instead. Fire when humidity stays above a level for longer than it normally does, not when it crosses it. Something like “above 80% for more than eight hours” never fires on an ordinary night that recovers at dawn, and fires immediately on a morning when the vents did not open.
Alert on the combination. The condition that actually threatens the crop is high humidity plus closed vents plus no fall by morning. A rule with two or three terms in it will be quieter and more specific than any single-reading rule can be, and this device already reports every term it needs.
The general principle underneath is worth more than the specific numbers: an alert should describe a state the equipment does not normally reach. If you cannot say what the normal band is, you are not ready to set a threshold, and the first month of monitoring is what tells you.
The numbers below are a worked example, not a promise. Put your own figures in.
A shipment of cut flowers rejected for grey mould is a total loss on that consignment plus the standing of the grower with the buyer, and the second one costs more than the first. Set against that, the monitoring is trivial. The real risk here is not the cost of the sensor, it is the cost of a badly configured rule.
Humidity, with duration
The reading is easy and the rule is the hard part. Alert on how long it stays high, not on the moment it crosses.
Vent position
Turns a humidity number into a diagnosis. High and venting is weather. High and shut is a fault.
Soil moisture
A reading with a genuinely abnormal threshold available, which is why its alerts still mean something.
Inside against outside temperature
The gap between them is the greenhouse doing its job. A narrowing gap on a sunny day means glass, shading or vents need attention.
The same four readings run across the other agriculture installations, aimed at different losses. A grain storage silo watches for the warm damp pockets that start spoilage where nobody can see them from outside. A broiler house is monitored because a ventilation failure costs the flock rather than a day of growth, which is a case where a sensitive threshold is entirely justified. An orchard frost watch exists for a handful of nights a season, and a drip irrigation block moved its owner from irrigating on the calendar to irrigating on the readings.
The threshold problem in this post is not agricultural. A classroom environment monitor watching CO2 climb through a lesson faces exactly the same question about where normal ends.
The device page shows the live readings, the charts above in their interactive form, and the alert history this post is about. If the device link below ever stops resolving, the public device gallery lists everything currently shared, and devices come and go from it as owners decide.
To put your own greenhouse on a chart, you can send readings without creating an account and see them arrive on a live chart in a couple of minutes, or read how to connect a first device.
Open this device Monitor your own equipment
Comments